

REPORT ON THE ANA OF 2014
REPORT ON THE ANA OF 2014
REPORT ON THE ANA OF 2014
- No tags were found...

Create successful ePaper yourself
Turn your PDF publications into a flip-book with our unique Google optimized e-Paper software.
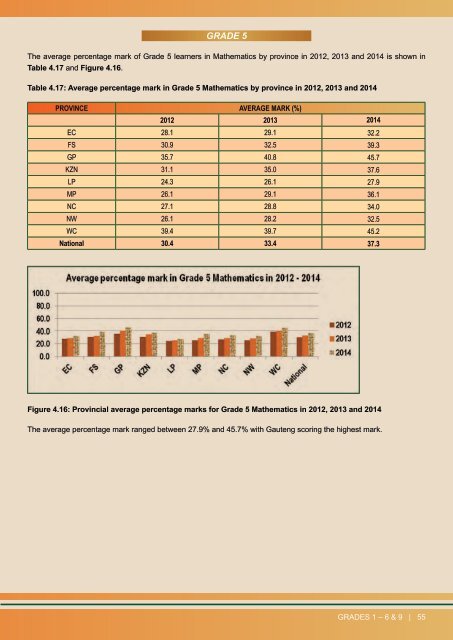
GRADE 5The average percentage mark of Grade 5 learners in Mathematics by province in 2012, 2013 and <strong>2014</strong> is shown inTable 4.17 and Figure 4.16.Table 4.17: Average percentage mark in Grade 5 Mathematics by province in 2012, 2013 and <strong>2014</strong>PROVINCE AVERAGE MARK (%)2012 2013 <strong>2014</strong>EC 28.1 29.1 32.2FS 30.9 32.5 39.3GP 35.7 40.8 45.7KZN 31.1 35.0 37.6LP 24.3 26.1 27.9MP 26.1 29.1 36.1NC 27.1 28.8 34.0NW 26.1 28.2 32.5WC 39.4 39.7 45.2National 30.4 33.4 37.3Figure 4.16: Provincial average percentage marks for Grade 5 Mathematics in 2012, 2013 and <strong>2014</strong>The average percentage mark ranged between 27.9% and 45.7% with Gauteng scoring the highest mark.GRADES 1 – 6 & 9 | 55