REPORT ON THE ANA OF 2014
REPORT ON THE ANA OF 2014
REPORT ON THE ANA OF 2014
- No tags were found...
Create successful ePaper yourself
Turn your PDF publications into a flip-book with our unique Google optimized e-Paper software.
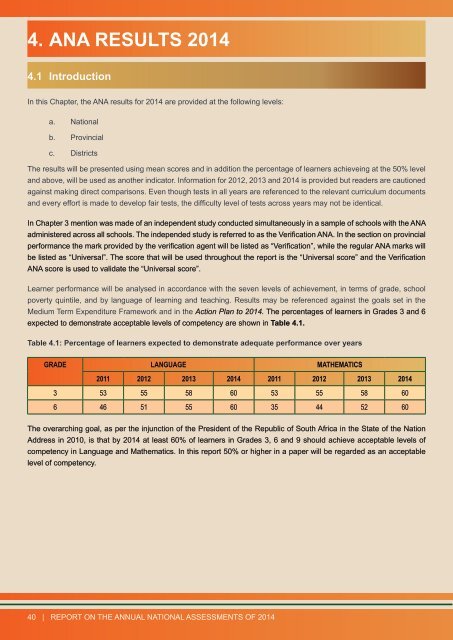
4. <strong>ANA</strong> RESULTS <strong>2014</strong>4.1 IntroductionIn this Chapter, the <strong>ANA</strong> results for <strong>2014</strong> are provided at the following levels:a. Nationalb. Provincialc. DistrictsThe results will be presented using mean scores and in addition the percentage of learners achieveing at the 50% leveland above, will be used as another indicator. Information for 2012, 2013 and <strong>2014</strong> is provided but readers are cautionedagainst making direct comparisons. Even though tests in all years are referenced to the relevant curriculum documentsand every effort is made to develop fair tests, the difficulty level of tests across years may not be identical.In Chapter 3 mention was made of an independent study conducted simultaneously in a sample of schools with the <strong>ANA</strong>administered across all schools. The independed study is referred to as the Verification <strong>ANA</strong>. In the section on provincialperformance the mark provided by the verification agent will be listed as “Verification”, while the regular <strong>ANA</strong> marks willbe listed as “Universal”. The score that will be used throughout the report is the “Universal score” and the Verification<strong>ANA</strong> score is used to validate the “Universal score”.Learner performance will be analysed in accordance with the seven levels of achievement, in terms of grade, schoolpoverty quintile, and by language of learning and teaching. Results may be referenced against the goals set in theMedium Term Expenditure Framework and in the Action Plan to <strong>2014</strong>. The percentages of learners in Grades 3 and 6expected to demonstrate acceptable levels of competency are shown in Table 4.1.Table 4.1: Percentage of learners expected to demonstrate adequate performance over yearsGRADE LANGUAGE MA<strong>THE</strong>MATICS2011 2012 2013 <strong>2014</strong> 2011 2012 2013 <strong>2014</strong>3 53 55 58 60 53 55 58 606 46 51 55 60 35 44 52 60The overarching goal, as per the injunction of the President of the Republic of South Africa in the State of the NationAddress in 2010, is that by <strong>2014</strong> at least 60% of learners in Grades 3, 6 and 9 should achieve acceptable levels ofcompetency in Language and Mathematics. In this report 50% or higher in a paper will be regarded as an acceptablelevel of competency.40 | <strong>REPORT</strong> <strong>ON</strong> <strong>THE</strong> ANNUAL NATI<strong>ON</strong>AL ASSESSMENTS <strong>OF</strong> <strong>2014</strong>


