

REPORT ON THE ANA OF 2014
REPORT ON THE ANA OF 2014
REPORT ON THE ANA OF 2014
- No tags were found...

Create successful ePaper yourself
Turn your PDF publications into a flip-book with our unique Google optimized e-Paper software.
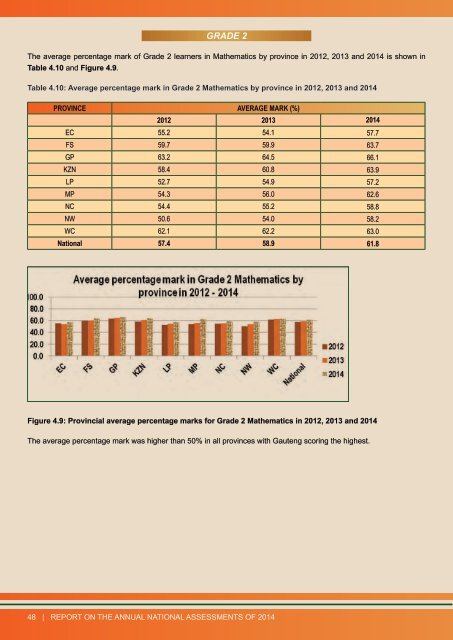
GRADE 2The average percentage mark of Grade 2 learners in Mathematics by province in 2012, 2013 and <strong>2014</strong> is shown inTable 4.10 and Figure 4.9.Table 4.10: Average percentage mark in Grade 2 Mathematics by province in 2012, 2013 and <strong>2014</strong>PROVINCE AVERAGE MARK (%)2012 2013 <strong>2014</strong>EC 55.2 54.1 57.7FS 59.7 59.9 63.7GP 63.2 64.5 66.1KZN 58.4 60.8 63.9LP 52.7 54.9 57.2MP 54.3 56.0 62.6NC 54.4 55.2 58.8NW 50.6 54.0 58.2WC 62.1 62.2 63.0National 57.4 58.9 61.8Figure 4.9: Provincial average percentage marks for Grade 2 Mathematics in 2012, 2013 and <strong>2014</strong>The average percentage mark was higher than 50% in all provinces with Gauteng scoring the highest.48 | <strong>REPORT</strong> <strong>ON</strong> <strong>THE</strong> ANNUAL NATI<strong>ON</strong>AL ASSESSMENTS <strong>OF</strong> <strong>2014</strong>