

REPORT ON THE ANA OF 2014
REPORT ON THE ANA OF 2014
REPORT ON THE ANA OF 2014
- No tags were found...

You also want an ePaper? Increase the reach of your titles
YUMPU automatically turns print PDFs into web optimized ePapers that Google loves.
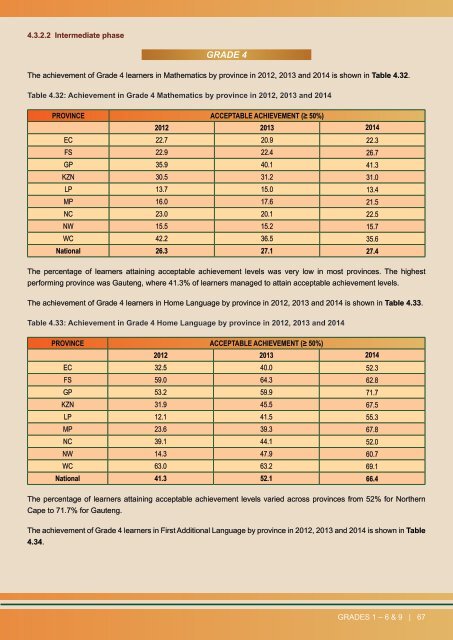
4.3.2.2 Intermediate phaseGRADE 4The achievement of Grade 4 learners in Mathematics by province in 2012, 2013 and <strong>2014</strong> is shown in Table 4.32.Table 4.32: Achievement in Grade 4 Mathematics by province in 2012, 2013 and <strong>2014</strong>PROVINCE ACCEPTABLE ACHIEVEMENT (≥ 50%)2012 2013 <strong>2014</strong>EC 22.7 20.9 22.3FS 22.9 22.4 26.7GP 35.9 40.1 41.3KZN 30.5 31.2 31.0LP 13.7 15.0 13.4MP 16.0 17.6 21.5NC 23.0 20.1 22.5NW 15.5 15.2 15.7WC 42.2 36.5 35.6National 26.3 27.1 27.4The percentage of learners attaining acceptable achievement levels was very low in most provinces. The highestperforming province was Gauteng, where 41.3% of learners managed to attain acceptable achievement levels.The achievement of Grade 4 learners in Home Language by province in 2012, 2013 and <strong>2014</strong> is shown in Table 4.33.Table 4.33: Achievement in Grade 4 Home Language by province in 2012, 2013 and <strong>2014</strong>PROVINCE ACCEPTABLE ACHIEVEMENT (≥ 50%)2012 2013 <strong>2014</strong>EC 32.5 40.0 52.3FS 59.0 64.3 62.8GP 53.2 59.9 71.7KZN 31.9 45.5 67.5LP 12.1 41.5 55.3MP 23.6 39.3 67.8NC 39.1 44.1 52.0NW 14.3 47.9 60.7WC 63.0 63.2 69.1National 41.3 52.1 66.4The percentage of learners attaining acceptable achievement levels varied across provinces from 52% for NorthernCape to 71.7% for Gauteng.The achievement of Grade 4 learners in First Additional Language by province in 2012, 2013 and <strong>2014</strong> is shown in Table4.34.GRADES 1 – 6 & 9 | 67