

REPORT ON THE ANA OF 2014
REPORT ON THE ANA OF 2014
REPORT ON THE ANA OF 2014
- No tags were found...

You also want an ePaper? Increase the reach of your titles
YUMPU automatically turns print PDFs into web optimized ePapers that Google loves.
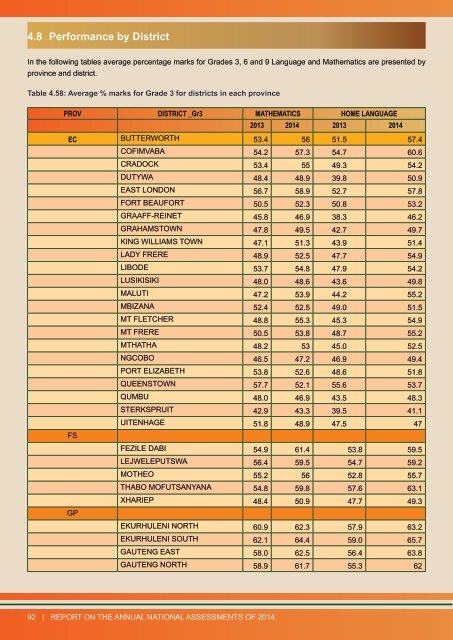
4.8 Performance by DistrictIn the following tables average percentage marks for Grades 3, 6 and 9 Language and Mathematics are presented byprovince and district.Table 4.58: Average % marks for Grade 3 for districts in each provincePROV DISTRICT _Gr3 MA<strong>THE</strong>MATICS HOME LANGUAGE2013 <strong>2014</strong> 2013 <strong>2014</strong>EC BUTTERWORTH 53.4 56 51.5 57.4C<strong>OF</strong>IMVABA 54.2 57.3 54.7 60.6CRADOCK 53.4 55 49.3 54.2DUTYWA 48.4 48.9 39.8 50.9EAST L<strong>ON</strong>D<strong>ON</strong> 56.7 58.9 52.7 57.8FORT BEAUFORT 50.5 52.3 50.8 53.2GRAAFF-REINET 45.8 46.9 38.3 46.2GRAHAMSTOWN 47.8 49.5 42.7 49.7KING WILLIAMS TOWN 47.1 51.3 43.9 51.4LADY FRERE 48.9 52.5 47.7 54.9LIBODE 53.7 54.8 47.9 54.2LUSIKISIKI 48.0 48.6 43.6 49.8MALUTI 47.2 53.9 44.2 55.2MBIZ<strong>ANA</strong> 52.4 52.5 49.0 51.5MT FLETCHER 48.8 55.3 45.3 54.9MT FRERE 50.5 53.8 48.7 55.2MTHATHA 48.2 53 45.0 52.5NGCOBO 46.5 47.2 46.9 49.4PORT ELIZABETH 53.8 52.6 48.6 51.8QUEENSTOWN 57.7 52.1 55.6 53.7QUMBU 48.0 46.9 43.5 48.3STERKSPRUIT 42.9 43.3 39.5 41.1UITENHAGE 51.8 48.9 47.5 47FSFEZILE DABI 54.9 61.4 53.8 59.5LEJWELEPUTSWA 56.4 59.5 54.7 59.2MO<strong>THE</strong>O 55.2 56 52.8 55.7THABO M<strong>OF</strong>UTSANY<strong>ANA</strong> 54.8 59.8 57.6 63.1XHARIEP 48.4 50.9 47.7 49.3GPEKURHULENI NORTH 60.9 62.3 57.9 63.2EKURHULENI SOUTH 62.1 64.4 59.0 65.7GAUTENG EAST 58.0 62.5 56.4 63.8GAUTENG NORTH 58.9 61.7 55.3 6292 | <strong>REPORT</strong> <strong>ON</strong> <strong>THE</strong> ANNUAL NATI<strong>ON</strong>AL ASSESSMENTS <strong>OF</strong> <strong>2014</strong>