

REPORT ON THE ANA OF 2014
REPORT ON THE ANA OF 2014
REPORT ON THE ANA OF 2014
- No tags were found...

You also want an ePaper? Increase the reach of your titles
YUMPU automatically turns print PDFs into web optimized ePapers that Google loves.
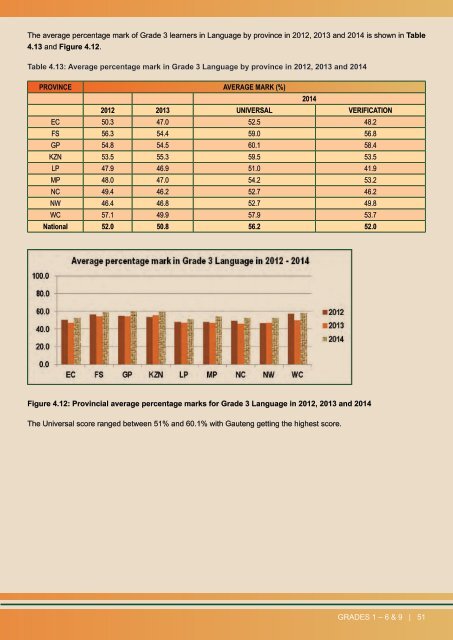
The average percentage mark of Grade 3 learners in Language by province in 2012, 2013 and <strong>2014</strong> is shown in Table4.13 and Figure 4.12.Table 4.13: Average percentage mark in Grade 3 Language by province in 2012, 2013 and <strong>2014</strong>PROVINCE AVERAGE MARK (%)<strong>2014</strong>2012 2013 UNIVERSAL VERIFICATI<strong>ON</strong>EC 50.3 47.0 52.5 48.2FS 56.3 54.4 59.0 56.8GP 54.8 54.5 60.1 58.4KZN 53.5 55.3 59.5 53.5LP 47.9 46.9 51.0 41.9MP 48.0 47.0 54.2 53.2NC 49.4 46.2 52.7 46.2NW 46.4 46.8 52.7 49.8WC 57.1 49.9 57.9 53.7National 52.0 50.8 56.2 52.0Figure 4.12: Provincial average percentage marks for Grade 3 Language in 2012, 2013 and <strong>2014</strong>The Universal score ranged between 51% and 60.1% with Gauteng getting the highest score.GRADES 1 – 6 & 9 | 51