

REPORT ON THE ANA OF 2014
REPORT ON THE ANA OF 2014
REPORT ON THE ANA OF 2014
- No tags were found...

Create successful ePaper yourself
Turn your PDF publications into a flip-book with our unique Google optimized e-Paper software.
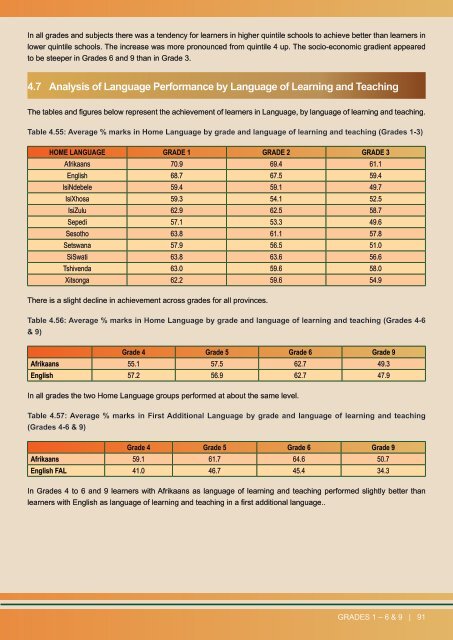
In all grades and subjects there was a tendency for learners in higher quintile schools to achieve better than learners inlower quintile schools. The increase was more pronounced from quintile 4 up. The socio-economic gradient appearedto be steeper in Grades 6 and 9 than in Grade 3.4.7 Analysis of Language Performance by Language of Learning and TeachingThe tables and figures below represent the achievement of learners in Language, by language of learning and teaching.Table 4.55: Average % marks in Home Language by grade and language of learning and teaching (Grades 1-3)HOME LANGUAGE GRADE 1 GRADE 2 GRADE 3Afrikaans 70.9 69.4 61.1English 68.7 67.5 59.4IsiNdebele 59.4 59.1 49.7IsiXhosa 59.3 54.1 52.5IsiZulu 62.9 62.5 58.7Sepedi 57.1 53.3 49.6Sesotho 63.8 61.1 57.8Setswana 57.9 56.5 51.0SiSwati 63.8 63.6 56.6Tshivenda 63.0 59.6 58.0Xitsonga 62.2 59.6 54.9There is a slight decline in achievement across grades for all provinces.Table 4.56: Average % marks in Home Language by grade and language of learning and teaching (Grades 4-6& 9)Grade 4 Grade 5 Grade 6 Grade 9Afrikaans 55.1 57.5 62.7 49.3English 57.2 56.9 62.7 47.9In all grades the two Home Language groups performed at about the same level.Table 4.57: Average % marks in First Additional Language by grade and language of learning and teaching(Grades 4-6 & 9)Grade 4 Grade 5 Grade 6 Grade 9Afrikaans 59.1 61.7 64.6 50.7English FAL 41.0 46.7 45.4 34.3In Grades 4 to 6 and 9 learners with Afrikaans as language of learning and teaching performed slightly better thanlearners with English as language of learning and teaching in a first additional language..GRADES 1 – 6 & 9 | 91