

REPORT ON THE ANA OF 2014
REPORT ON THE ANA OF 2014
REPORT ON THE ANA OF 2014
- No tags were found...

You also want an ePaper? Increase the reach of your titles
YUMPU automatically turns print PDFs into web optimized ePapers that Google loves.
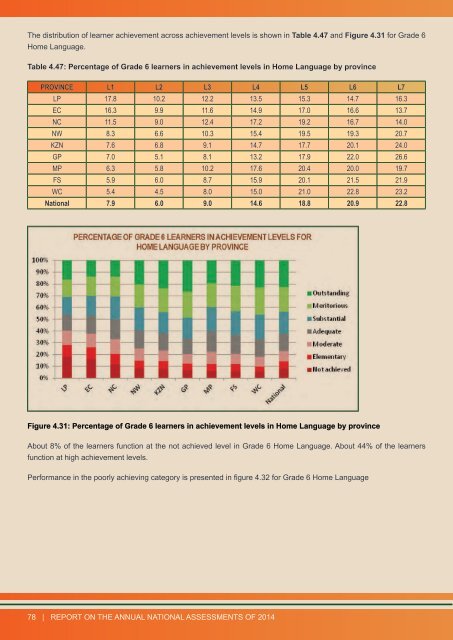
The distribution of learner achievement across achievement levels is shown in Table 4.47 and Figure 4.31 for Grade 6Home Language.Table 4.47: Percentage of Grade 6 learners in achievement levels in Home Language by provincePROVINCE L1 L2 L3 L4 L5 L6 L7LP 17.8 10.2 12.2 13.5 15.3 14.7 16.3EC 16.3 9.9 11.6 14.9 17.0 16.6 13.7NC 11.5 9.0 12.4 17.2 19.2 16.7 14.0NW 8.3 6.6 10.3 15.4 19.5 19.3 20.7KZN 7.6 6.8 9.1 14.7 17.7 20.1 24.0GP 7.0 5.1 8.1 13.2 17.9 22.0 26.6MP 6.3 5.8 10.2 17.6 20.4 20.0 19.7FS 5.9 6.0 8.7 15.9 20.1 21.5 21.9WC 5.4 4.5 8.0 15.0 21.0 22.8 23.2National 7.9 6.0 9.0 14.6 18.8 20.9 22.8Figure 4.31: Percentage of Grade 6 learners in achievement levels in Home Language by provinceAbout 8% of the learners function at the not achieved level in Grade 6 Home Language. About 44% of the learnersfunction at high achievement levels.Performance in the poorly achieving category is presented in figure 4.32 for Grade 6 Home Language78 | <strong>REPORT</strong> <strong>ON</strong> <strong>THE</strong> ANNUAL NATI<strong>ON</strong>AL ASSESSMENTS <strong>OF</strong> <strong>2014</strong>