

REPORT ON THE ANA OF 2014
REPORT ON THE ANA OF 2014
REPORT ON THE ANA OF 2014
- No tags were found...

Create successful ePaper yourself
Turn your PDF publications into a flip-book with our unique Google optimized e-Paper software.
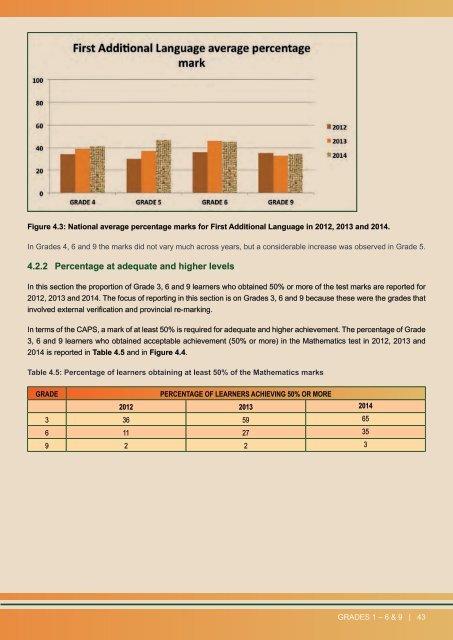
Figure 4.3: National average percentage marks for First Additional Language in 2012, 2013 and <strong>2014</strong>.In Grades 4, 6 and 9 the marks did not vary much across years, but a considerable increase was observed in Grade 5.4.2.2 Percentage at adequate and higher levelsIn this section the proportion of Grade 3, 6 and 9 learners who obtained 50% or more of the test marks are reported for2012, 2013 and <strong>2014</strong>. The focus of reporting in this section is on Grades 3, 6 and 9 because these were the grades thatinvolved external verification and provincial re-marking.In terms of the CAPS, a mark of at least 50% is required for adequate and higher achievement. The percentage of Grade3, 6 and 9 learners who obtained acceptable achievement (50% or more) in the Mathematics test in 2012, 2013 and<strong>2014</strong> is reported in Table 4.5 and in Figure 4.4.Table 4.5: Percentage of learners obtaining at least 50% of the Mathematics marksGRADEPERCENTAGE <strong>OF</strong> LEARNERS ACHIEVING 50% OR MORE2012 2013 <strong>2014</strong>3 36 59 656 11 27 359 2 2 3GRADES 1 – 6 & 9 | 43