

REPORT ON THE ANA OF 2014
REPORT ON THE ANA OF 2014
REPORT ON THE ANA OF 2014
- No tags were found...

Create successful ePaper yourself
Turn your PDF publications into a flip-book with our unique Google optimized e-Paper software.
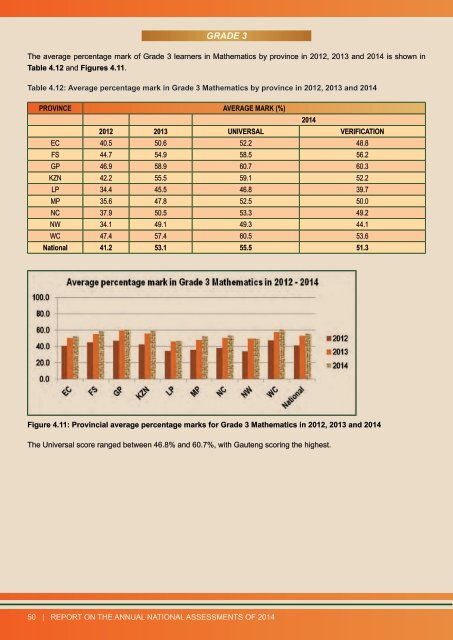
GRADE 3The average percentage mark of Grade 3 learners in Mathematics by province in 2012, 2013 and <strong>2014</strong> is shown inTable 4.12 and Figures 4.11.Table 4.12: Average percentage mark in Grade 3 Mathematics by province in 2012, 2013 and <strong>2014</strong>PROVINCE AVERAGE MARK (%)<strong>2014</strong>2012 2013 UNIVERSAL VERIFICATI<strong>ON</strong>EC 40.5 50.6 52.2 48.8FS 44.7 54.9 58.5 56.2GP 46.9 58.9 60.7 60.3KZN 42.2 55.5 59.1 52.2LP 34.4 45.5 46.8 39.7MP 35.6 47.8 52.5 50.0NC 37.9 50.5 53.3 49.2NW 34.1 49.1 49.3 44.1WC 47.4 57.4 60.5 53.6National 41.2 53.1 55.5 51.3Figure 4.11: Provincial average percentage marks for Grade 3 Mathematics in 2012, 2013 and <strong>2014</strong>The Universal score ranged between 46.8% and 60.7%, with Gauteng scoring the highest.50 | <strong>REPORT</strong> <strong>ON</strong> <strong>THE</strong> ANNUAL NATI<strong>ON</strong>AL ASSESSMENTS <strong>OF</strong> <strong>2014</strong>