

REPORT ON THE ANA OF 2014
REPORT ON THE ANA OF 2014
REPORT ON THE ANA OF 2014
- No tags were found...

You also want an ePaper? Increase the reach of your titles
YUMPU automatically turns print PDFs into web optimized ePapers that Google loves.
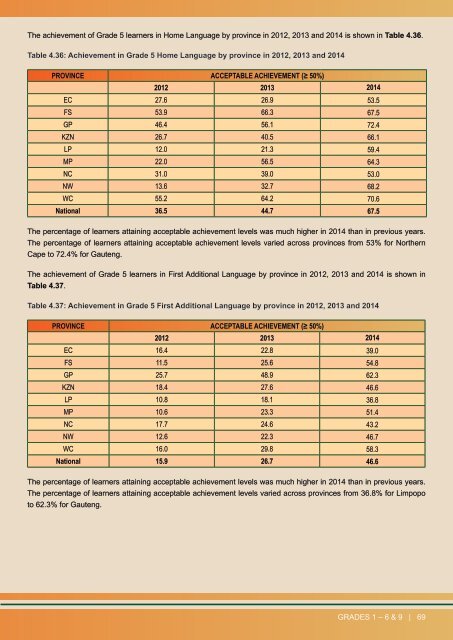
The achievement of Grade 5 learners in Home Language by province in 2012, 2013 and <strong>2014</strong> is shown in Table 4.36.Table 4.36: Achievement in Grade 5 Home Language by province in 2012, 2013 and <strong>2014</strong>PROVINCE ACCEPTABLE ACHIEVEMENT (≥ 50%)2012 2013 <strong>2014</strong>EC 27.6 26.9 53.5FS 53.9 66.3 67.5GP 46.4 56.1 72.4KZN 26.7 40.5 66.1LP 12.0 21.3 59.4MP 22.0 56.5 64.3NC 31.0 39.0 53.0NW 13.6 32.7 68.2WC 55.2 64.2 70.6National 36.5 44.7 67.5The percentage of learners attaining acceptable achievement levels was much higher in <strong>2014</strong> than in previous years.The percentage of learners attaining acceptable achievement levels varied across provinces from 53% for NorthernCape to 72.4% for Gauteng.The achievement of Grade 5 learners in First Additional Language by province in 2012, 2013 and <strong>2014</strong> is shown inTable 4.37.Table 4.37: Achievement in Grade 5 First Additional Language by province in 2012, 2013 and <strong>2014</strong>PROVINCE ACCEPTABLE ACHIEVEMENT (≥ 50%)2012 2013 <strong>2014</strong>EC 16.4 22.8 39.0FS 11.5 25.6 54.8GP 25.7 48.9 62.3KZN 18.4 27.6 46.6LP 10.8 18.1 36.8MP 10.6 23.3 51.4NC 17.7 24.6 43.2NW 12.6 22.3 46.7WC 16.0 29.8 58.3National 15.9 26.7 46.6The percentage of learners attaining acceptable achievement levels was much higher in <strong>2014</strong> than in previous years.The percentage of learners attaining acceptable achievement levels varied across provinces from 36.8% for Limpopoto 62.3% for Gauteng.GRADES 1 – 6 & 9 | 69