- Page 1:
RaiManagementJournalAn Initiative o
- Page 4 and 5:
From the Editor’s DeskIt gives me
- Page 6 and 7:
Training Delivery and Methodology i
- Page 8 and 9:
The work force ofan organizationbec
- Page 10 and 11:
Choice of trainingand delivery meth
- Page 12 and 13:
Research studies ofmemory following
- Page 14 and 15:
Table -3: Perception of employees r
- Page 16:
Table -5: Perception of employees r
- Page 19 and 20:
Table -8: Perception of employees r
- Page 21 and 22:
Reference• Bhatia, S.K (1989).
- Page 23 and 24:
celebrity. Keeping these two things
- Page 25 and 26:
Figure IIFigure IIIDecember 2010 Vo
- Page 27 and 28:
• The Pepsi Campaign after theInd
- Page 29 and 30:
Table showing PERCENTAGE OF FAMILIA
- Page 31 and 32:
NAMETable showing PERCENTAGE OF Q-S
- Page 33 and 34:
and Irfan Pathan have beenranked at
- Page 35 and 36:
REFERENCESBOOKS -• Cloe, E. Kenne
- Page 37 and 38:
sations moving forward?In order to
- Page 39 and 40:
When studying the essentials of ano
- Page 41 and 42:
The effectiveness of the currentmot
- Page 43 and 44:
Fig.3: Ranking of Motivational Fact
- Page 46 and 47:
It seems clear thatIndian organisat
- Page 48 and 49:
• Kumar, N. (2001) Soft Ware Indu
- Page 51 and 52:
table 1. On an average, restaurants
- Page 53 and 54:
is also a major factor which effect
- Page 55 and 56:
careful analysis of the market ands
- Page 57 and 58:
Table 5: Size of the restaurants in
- Page 59 and 60:
Table 12: Strategy for promoting re
- Page 62 and 63: ...there will be atextile boom inIn
- Page 64 and 65: apparel industry, be it export ordo
- Page 67 and 68: It is clear from table 5 that solep
- Page 69 and 70: Table 8: Ranking of various problem
- Page 71 and 72: It is evident from table 10 that th
- Page 73 and 74: Table 12 shows that the respondents
- Page 75 and 76: to more than 100 countries worldwid
- Page 77 and 78: An Empirical Study on Indian Health
- Page 79 and 80: Table-1: Gross Premium from Busines
- Page 81 and 82: On August 15, 2007, the PrimeMinist
- Page 83 and 84: data collected from the respondents
- Page 85 and 86: Profile, purpose and investingpract
- Page 87 and 88: The Percentage Rank Analysis isappl
- Page 89 and 90: Based on the Average PercentageAnal
- Page 91 and 92: OBJECTIVE-3:To study the factors th
- Page 93 and 94: FUTURE CHANGEEXPECTEDAt present whe
- Page 95 and 96: Random walks in stock market prices
- Page 97 and 98: eported forsome indices.Kok and Lee
- Page 99 and 100: SAMPLEFrom the list of Oil and Gas
- Page 101 and 102: • Barnes, P. (1986) Thin trading
- Page 103 and 104: Thus, this paper has incorporateddi
- Page 105 and 106: hypotheses of the information conte
- Page 107 and 108: The present study addresses itsobje
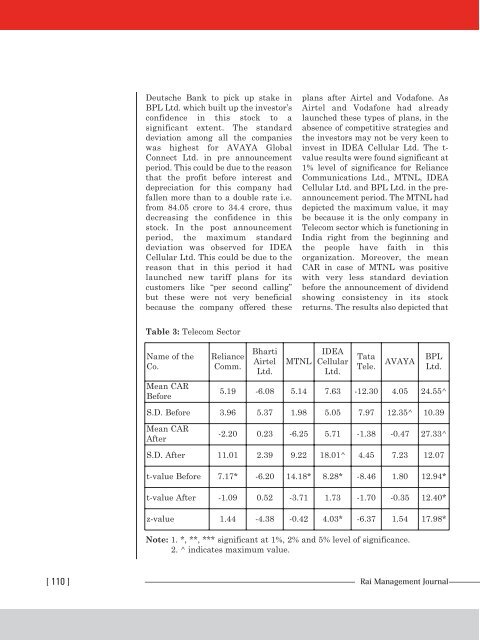
- Page 109 and 110: Deviations are similarly compared i
- Page 111: The remaining banks did not show an
- Page 115 and 116: constant dividend every year on the
- Page 118 and 119: Organized retail canbe defined as a
- Page 120 and 121: In the midst of the unorganised ret
- Page 122 and 123: convenience are some of majorattrib
- Page 124 and 125: STATISTICAL ANALYSESThe 475 usable
- Page 126 and 127: The Table 4 gives the 6 extracted f
- Page 128 and 129: The most significant factor thatdet
- Page 130 and 131: • Mulhern, F., and Leone, R., 199
- Page 132 and 133: carefully/exactly identified group
- Page 134 and 135: interaction effects. Variations in
- Page 136 and 137: eduction, indicating that the decli
- Page 138 and 139: Rs.10000 to Rs.20000 prefer maligai
- Page 140 and 141: Table 6: Reason for purchasing at a
- Page 142 and 143: Table 9: Monthly income and frequen
- Page 144 and 145: Once “time spent” by the users
- Page 146 and 147: Out of 200 respondents 111responden
- Page 148 and 149: etail stores are facing.VII. PREFER
- Page 150 and 151: From table 22 it can be inferred th
- Page 152 and 153: Role of Relationship in Pharmaceuti
- Page 154 and 155: Wholesaler, animportantmiddleman fo
- Page 156 and 157: ... a medicalrepresentative needsto
- Page 158 and 159: ole in selling the products. And74(
- Page 160 and 161: On the Basis ofQualificationOut of
- Page 162 and 163:
Figure 7Figure 8[ 160 ] Rai Managem
- Page 164 and 165:
Empirical Study On PerformanceMeasu
- Page 166 and 167:
these non- productive assets wasalm
- Page 168 and 169:
Tools for Analysis:First of all the
- Page 170 and 171:
... the commonstrength of theplasti
- Page 172 and 173:
adversely. Thus the common problems
- Page 174 and 175:
• Nimbalkar .B. Chairman & Managi
- Page 176 and 177:
Customersatisfaction and theservice
- Page 178 and 179:
The tourismindustry of Indiahas exp
- Page 180 and 181:
The hotel industryof India is one o
- Page 182 and 183:
Reichheld and sche(2000) embracedth
- Page 184 and 185:
Customersatisfaction is verycrucial
- Page 186 and 187:
2010 and 2020 respectively whichcal
- Page 188 and 189:
• Zineldin, m. (1999), ``explorin
- Page 190:
RNI NO.: DELENG/2004/12383Printed a


