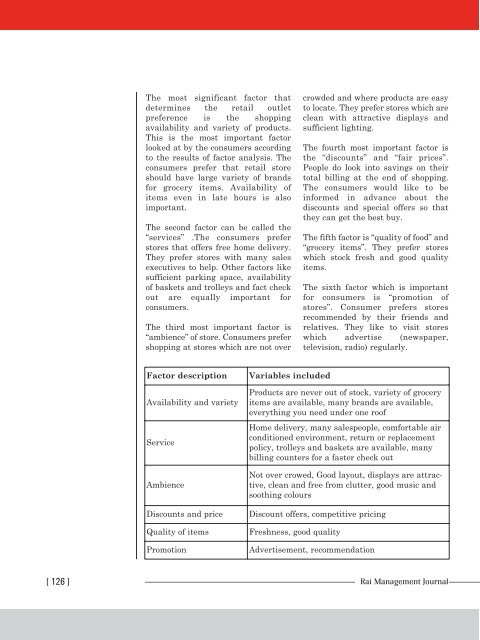
The most significant factor thatdetermines the retail outletpreference is the shoppingavailability and variety of products.This is the most important factorlooked at by the consumers accordingto the results of factor analysis. Theconsumers prefer that retail storeshould have large variety of brandsfor grocery items. Availability ofitems even in late hours is alsoimportant.The second factor can be called the“services” .The consumers preferstores that offers free home delivery.They prefer stores with many salesexecutives to help. Other factors likesufficient parking space, availabilityof baskets and trolleys and fact checkout are equally important forconsumers.The third most important factor is“ambience” of store. Consumers prefershopping at stores which are not overcrowded and where products are easyto locate. They prefer stores which areclean with attractive displays andsufficient lighting.The fourth most important factor isthe “discounts” and “fair prices”.People do look into savings on theirtotal billing at the end of shopping.The consumers would like to beinformed in advance about thediscounts and special offers so thatthey can get the best buy.The fifth factor is “quality of food” and“grocery items”. They prefer storeswhich stock fresh and good qualityitems.The sixth factor which is importantfor consumers is “promotion ofstores”. Consumer prefers storesrecommended by their friends andrelatives. They like to visit storeswhich advertise (newspaper,television, radio) regularly.Factor descriptionAvailability and varietyServiceAmbienceDiscounts and priceQuality of itemsPromotionVariables includedProducts are never out of stock, variety of groceryitems are available, many brands are available,everything you need under one roofHome delivery, many salespeople, comfortable airconditioned environment, return or replacementpolicy, trolleys and baskets are available, manybilling counters for a faster check out<strong>No</strong>t over crowed, Good layout, displays are attractive,clean and free from clutter, good music andsoothing coloursDiscount offers, competitive pricingFreshness, good qualityAdvertisement, recommendation[ 126 ] Rai Management Journal
CONCLUSIONThe study focused on finding out themajor attributes of the retail stores asperceived by the consumers in Punjab.The methodology adopted was astructured questionnaire and theanalysis was done using “principalcomponent method”.The study shows that there are sixmajor factors that consumers prefer asfar as the retail stores are concerned.These factors include availability &variety, service, ambience, discounts& price, quality of products, andpromotion.The knowledge of these factors is veryuseful to retailers and the strategiststo plan the policy and formulatestrategies accordingly for customerretention and improving loyaltytowards their store. The changingconsumer need can be understood andplans be accordingly implemented.The consumers are more inclined toget an experience of their shopping.Purchasing what they require is thedrive for coming to retail store, but inthe process they want a wonderfuloverall shopping experience. This maybe mainly to relieve them from theday-to-day stressful life. The consumersdo not want the shopping alsoto be another pain. The shopping placeshould be convenient, a place wherethey can relax, and can also lay theirhands on whatever they wanted.These retail outlets should focus onimproving their service focusing onimproving the convenience of the consumers.They should try to attractnew consumers and also retain theexisting ones by adopting promotionaloffers, adding value to their shoppingexperience and overcoming theirshortcoming on these attributes.REFERENCES• Amy Wong, Amrik Sohal, (2003) "Assessingcustomer-salesperson interactions in a retailchain: differences between city and countryretail districts", Marketing Intelligence &Planning, Vol. 21 Iss: 5, pp.292 – 304• Argentina Spiller A, Bolten J andKennerknecht R (2006), “CustomerSatisfaction and Loyalty as Success Factorsin Organic Food Retailing”, paper presentedat 16th Annual World Forum andSymposium “Agribusiness, Food, Health,and Nutrition”, IAMA Conference,• Bearden W O (1977), “DeterminantAttributes of Store Patronage: Downtownversus Outlying Shopping Centers”, Journalof Retailing, Vol. 53, <strong>No</strong>. 2.• Berry, L. J. (1969), The Components ofDepartment Store Image: A Theoretical andEmpirical Analysis, Journal of Retailing,45, 3-20.• Benefits of Modern Trade to the IndianEconomy, The Rising Elephant, A PWC, CIIpublication• Doyle P and Fenwick I (1975), “How StoreImage Affects Shopping Habits in GroceryChains”,Journal of Retailing, Vol. 50,annual issue.• Expanding Opportunities for GlobalRetailers, The 2010 A. T. Kearney GlobalRetail Development Index,www.atkearney.com, accessed 04/02/10.• Fisk, G. (1961), A Conceptual Model forStudying Customer Image, Journal ofRetailing, 37, 1-8.• Hasty, R. and Reardon, J., (1997). RetailManagement. New York: Mcgraw Hill• Martineau, P. (1958), The Personality of theRetail Store, Harvard Business Review.• Lindquist, J. D. (1974), Meaning of Image: ASurvey of Empirical and HypotheticalEvidence, Journal of Retailing, 50, 29-38.December 2010 Vol. 7, Issue 2[ 127 ]
- Page 1:
RaiManagementJournalAn Initiative o
- Page 4 and 5:
From the Editor’s DeskIt gives me
- Page 6 and 7:
Training Delivery and Methodology i
- Page 8 and 9:
The work force ofan organizationbec
- Page 10 and 11:
Choice of trainingand delivery meth
- Page 12 and 13:
Research studies ofmemory following
- Page 14 and 15:
Table -3: Perception of employees r
- Page 16:
Table -5: Perception of employees r
- Page 19 and 20:
Table -8: Perception of employees r
- Page 21 and 22:
Reference• Bhatia, S.K (1989).
- Page 23 and 24:
celebrity. Keeping these two things
- Page 25 and 26:
Figure IIFigure IIIDecember 2010 Vo
- Page 27 and 28:
• The Pepsi Campaign after theInd
- Page 29 and 30:
Table showing PERCENTAGE OF FAMILIA
- Page 31 and 32:
NAMETable showing PERCENTAGE OF Q-S
- Page 33 and 34:
and Irfan Pathan have beenranked at
- Page 35 and 36:
REFERENCESBOOKS -• Cloe, E. Kenne
- Page 37 and 38:
sations moving forward?In order to
- Page 39 and 40:
When studying the essentials of ano
- Page 41 and 42:
The effectiveness of the currentmot
- Page 43 and 44:
Fig.3: Ranking of Motivational Fact
- Page 46 and 47:
It seems clear thatIndian organisat
- Page 48 and 49:
• Kumar, N. (2001) Soft Ware Indu
- Page 51 and 52:
table 1. On an average, restaurants
- Page 53 and 54:
is also a major factor which effect
- Page 55 and 56:
careful analysis of the market ands
- Page 57 and 58:
Table 5: Size of the restaurants in
- Page 59 and 60:
Table 12: Strategy for promoting re
- Page 62 and 63:
...there will be atextile boom inIn
- Page 64 and 65:
apparel industry, be it export ordo
- Page 67 and 68:
It is clear from table 5 that solep
- Page 69 and 70:
Table 8: Ranking of various problem
- Page 71 and 72:
It is evident from table 10 that th
- Page 73 and 74:
Table 12 shows that the respondents
- Page 75 and 76:
to more than 100 countries worldwid
- Page 77 and 78: An Empirical Study on Indian Health
- Page 79 and 80: Table-1: Gross Premium from Busines
- Page 81 and 82: On August 15, 2007, the PrimeMinist
- Page 83 and 84: data collected from the respondents
- Page 85 and 86: Profile, purpose and investingpract
- Page 87 and 88: The Percentage Rank Analysis isappl
- Page 89 and 90: Based on the Average PercentageAnal
- Page 91 and 92: OBJECTIVE-3:To study the factors th
- Page 93 and 94: FUTURE CHANGEEXPECTEDAt present whe
- Page 95 and 96: Random walks in stock market prices
- Page 97 and 98: eported forsome indices.Kok and Lee
- Page 99 and 100: SAMPLEFrom the list of Oil and Gas
- Page 101 and 102: • Barnes, P. (1986) Thin trading
- Page 103 and 104: Thus, this paper has incorporateddi
- Page 105 and 106: hypotheses of the information conte
- Page 107 and 108: The present study addresses itsobje
- Page 109 and 110: Deviations are similarly compared i
- Page 111 and 112: The remaining banks did not show an
- Page 113 and 114: at this time the Telecom sector had
- Page 115 and 116: constant dividend every year on the
- Page 118 and 119: Organized retail canbe defined as a
- Page 120 and 121: In the midst of the unorganised ret
- Page 122 and 123: convenience are some of majorattrib
- Page 124 and 125: STATISTICAL ANALYSESThe 475 usable
- Page 126 and 127: The Table 4 gives the 6 extracted f
- Page 130 and 131: • Mulhern, F., and Leone, R., 199
- Page 132 and 133: carefully/exactly identified group
- Page 134 and 135: interaction effects. Variations in
- Page 136 and 137: eduction, indicating that the decli
- Page 138 and 139: Rs.10000 to Rs.20000 prefer maligai
- Page 140 and 141: Table 6: Reason for purchasing at a
- Page 142 and 143: Table 9: Monthly income and frequen
- Page 144 and 145: Once “time spent” by the users
- Page 146 and 147: Out of 200 respondents 111responden
- Page 148 and 149: etail stores are facing.VII. PREFER
- Page 150 and 151: From table 22 it can be inferred th
- Page 152 and 153: Role of Relationship in Pharmaceuti
- Page 154 and 155: Wholesaler, animportantmiddleman fo
- Page 156 and 157: ... a medicalrepresentative needsto
- Page 158 and 159: ole in selling the products. And74(
- Page 160 and 161: On the Basis ofQualificationOut of
- Page 162 and 163: Figure 7Figure 8[ 160 ] Rai Managem
- Page 164 and 165: Empirical Study On PerformanceMeasu
- Page 166 and 167: these non- productive assets wasalm
- Page 168 and 169: Tools for Analysis:First of all the
- Page 170 and 171: ... the commonstrength of theplasti
- Page 172 and 173: adversely. Thus the common problems
- Page 174 and 175: • Nimbalkar .B. Chairman & Managi
- Page 176 and 177: Customersatisfaction and theservice
- Page 178 and 179:
The tourismindustry of Indiahas exp
- Page 180 and 181:
The hotel industryof India is one o
- Page 182 and 183:
Reichheld and sche(2000) embracedth
- Page 184 and 185:
Customersatisfaction is verycrucial
- Page 186 and 187:
2010 and 2020 respectively whichcal
- Page 188 and 189:
• Zineldin, m. (1999), ``explorin
- Page 190:
RNI NO.: DELENG/2004/12383Printed a