- Page 1 and 2:
NepalMonitoring the situationof chi
- Page 3:
Nepal Multiple Indicator Cluster Su
- Page 6 and 7:
NMICS 2010, Mid- and Far Western Re
- Page 10:
ForewordIt is my great pleasure to
- Page 13 and 14:
NMICS 2010, Mid- and Far Western Re
- Page 15 and 16:
NMICS 2010, Mid- and Far Western Re
- Page 17 and 18:
Executive SummarySummary of finding
- Page 19 and 20:
NMICS 2010, Mid- and Far Western Re
- Page 21 and 22:
NMICS 2010, Mid- and Far Western Re
- Page 23 and 24:
I. IntroductionBackgroundThis repor
- Page 25 and 26:
II.Sample and Survey MethodologySam
- Page 27 and 28:
NMICS 2010, Mid- and Far Western Re
- Page 29 and 30:
Mid-WesternFar WesternMid-WesternMo
- Page 31 and 32:
Age groupNMICS 2010, Mid- and Far W
- Page 33 and 34:
NMICS 2010, Mid- and Far Western Re
- Page 35 and 36:
NMICS 2010, Mid- and Far Western Re
- Page 37 and 38:
IV.NutritionNutritional statusChild
- Page 39 and 40:
PercentNMICS 2010, Mid- and Far Wes
- Page 41 and 42:
0-12-34-56-78-910-1112-1314-1516-17
- Page 43 and 44:
NMICS 2010, Mid- and Far Western Re
- Page 45 and 46:
NMICS 2010, Mid- and Far Western Re
- Page 47 and 48:
NMICS 2010, Mid- and Far Western Re
- Page 49 and 50:
NMICS 2010, Mid- and Far Western Re
- Page 51 and 52:
NMICS 2010, Mid- and Far Western Re
- Page 53 and 54:
NMICS 2010, Mid- and Far Western Re
- Page 55 and 56:
PercentNMICS 2010, Mid- and Far Wes
- Page 57 and 58:
NMICS 2010, Mid- and Far Western Re
- Page 59 and 60:
NMICS 2010, Mid- and Far Western Re
- Page 61 and 62:
NMICS 2010, Mid- and Far Western Re
- Page 63 and 64:
Table CH.6: Feeding practices durin
- Page 65 and 66:
NMICS 2010, Mid- and Far Western Re
- Page 67 and 68:
Cont’d Table CH.7: Oral rehydrati
- Page 69 and 70:
Government hospitalPrimary healthca
- Page 71 and 72:
NMICS 2010, Mid- and Far Western Re
- Page 73 and 74:
Table CH.10: Solid fuel usePercenta
- Page 75 and 76:
NMICS 2010, Mid- and Far Western Re
- Page 77 and 78:
Cont’d Table CH.12: Anti-malarial
- Page 79 and 80:
NMICS 2010, Mid- and Far Western Re
- Page 81 and 82:
Table WS.1: Use of improved water s
- Page 83 and 84:
Table WS.2: Household water treatme
- Page 85 and 86:
NMICS 2010, Mid- and Far Western Re
- Page 87 and 88:
NMICS 2010, Mid- and Far Western Re
- Page 89 and 90:
NMICS 2010, Mid- and Far Western Re
- Page 91 and 92:
NMICS 2010, Mid- and Far Western Re
- Page 93 and 94:
NMICS 2010, Mid- and Far Western Re
- Page 95 and 96:
NMICS 2010, Mid- and Far Western Re
- Page 97 and 98:
NMICS 2010, Mid- and Far Western Re
- Page 99 and 100:
NMICS 2010, Mid- and Far Western Re
- Page 101 and 102:
NMICS 2010, Mid- and Far Western Re
- Page 103 and 104:
NMICS 2010, Mid- and Far Western Re
- Page 105 and 106:
NMICS 2010, Mid- and Far Western Re
- Page 107 and 108:
Cont’d Table RH.2: Unmet need for
- Page 109 and 110:
NMICS 2010, Mid- and Far Western Re
- Page 111 and 112:
NMICS 2010, Mid- and Far Western Re
- Page 113 and 114:
NMICS 2010, Mid- and Far Western Re
- Page 115 and 116:
Table RH.7: Assistance during deliv
- Page 117 and 118:
NMICS 2010, Mid- and Far Western Re
- Page 119 and 120:
NMICS 2010, Mid- and Far Western Re
- Page 121 and 122:
VIII.Child DevelopmentEarly childho
- Page 123 and 124:
NMICS 2010, Mid- and Far Western Re
- Page 126 and 127:
NMICS 2010, Mid- and Far Western Re
- Page 128 and 129:
NMICS 2010, Mid- and Far Western Re
- Page 130 and 131:
NMICS 2010, Mid- and Far Western Re
- Page 132 and 133:
NMICS 2010, Mid- and Far Western Re
- Page 134 and 135:
NMICS 2010, Mid- and Far Western Re
- Page 136 and 137:
NMICS 2010, Mid- and Far Western Re
- Page 138 and 139:
Cont’d Table ED.5: Secondary scho
- Page 140 and 141:
Table ED.7: School attendancePercen
- Page 142 and 143:
NMICS 2010, Mid- and Far Western Re
- Page 144 and 145:
NMICS 2010, Mid- and Far Western Re
- Page 146 and 147:
Table CP.2: Child labourPercentage
- Page 148 and 149:
NMICS 2010, Mid- and Far Western Re
- Page 150 and 151:
NMICS 2010, Mid- and Far Western Re
- Page 152 and 153:
NMICS 2010, Mid- and Far Western Re
- Page 154 and 155:
Cont’d Table CP.5: Early marriage
- Page 156 and 157:
Table CP.6: Trends in early marriag
- Page 158 and 159:
Table CP.7: Spousal age differenceP
- Page 160 and 161:
NMICS 2010, Mid- and Far Western Re
- Page 162 and 163:
NMICS 2010, Mid- and Far Western Re
- Page 164 and 165:
NMICS 2010, Mid- and Far Western Re
- Page 166 and 167:
NMICS 2010, Mid- and Far Western Re
- Page 168 and 169:
NMICS 2010, Mid- and Far Western Re
- Page 170 and 171:
Cont’d Table HA.2: Knowledge abou
- Page 172 and 173:
NMICS 2010, Mid- and Far Western Re
- Page 174 and 175: NMICS 2010, Mid- and Far Western Re
- Page 176 and 177: NMICS 2010, Mid- and Far Western Re
- Page 178 and 179: NMICS 2010, Mid- and Far Western Re
- Page 180 and 181: NMICS 2010, Mid- and Far Western Re
- Page 182 and 183: NMICS 2010, Mid- and Far Western Re
- Page 184 and 185: Table TA.1: Ever and current use of
- Page 186 and 187: NMICS 2010, Mid- and Far Western Re
- Page 188 and 189: NMICS 2010, Mid- and Far Western Re
- Page 190 and 191: XIV. Subjective well-beingIt is wel
- Page 192 and 193: Cont’d Table SW.1: Life satisfact
- Page 194 and 195: NMICS 2010, Mid- and Far Western Re
- Page 196 and 197: Appendix A. Sample DesignThe major
- Page 198 and 199: NMICS 2010, Mid- and Far Western Re
- Page 200 and 201: NMICS 2010, Mid- and Far Western Re
- Page 202 and 203: NMICS 2010, Mid- and Far Western Re
- Page 204 and 205: Appendix C. Estimates of Sampling E
- Page 206 and 207: Table SE.2: Sampling errors: Total
- Page 208 and 209: Table SE.3: Sampling errors: Urban
- Page 210 and 211: Table SE.4: Sampling errors: Rural
- Page 212 and 213: Table SE.5: Sampling errors: Mid-We
- Page 214 and 215: Table SE.6: Sampling errors: Mid-We
- Page 216 and 217: Table SE.7: Sampling errors: Mid-We
- Page 218 and 219: Table SE.8: Sampling errors: Far We
- Page 220 and 221: Table SE.9: Sampling errors: Far We
- Page 222 and 223: Table SE.10: Sampling errors: Far W
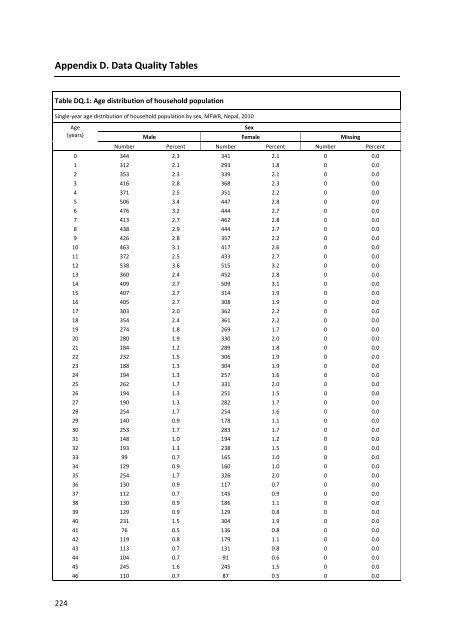
- Page 226 and 227: NMICS 2010, Mid- and Far Western Re
- Page 228 and 229: NMICS 2010, Mid- and Far Western Re
- Page 230 and 231: NMICS 2010, Mid- and Far Western Re
- Page 232 and 233: NMICS 2010, Mid- and Far Western Re
- Page 234 and 235: Appendix E. MICS4 Indicators: Numer
- Page 236 and 237: NMICS 2010, Mid- and Far Western Re
- Page 238 and 239: NMICS 2010, Mid- and Far Western Re
- Page 240 and 241: Appendix F. QuestionnairesNEPAL MUL
- Page 242 and 243: HL1.LinenumberHL2.Name, last nameHL
- Page 244 and 245: EDUCATIONFor household members age
- Page 246 and 247: WATER AND SANITATIONWS1. WHAT IS TH
- Page 248 and 249: WS7D.IS THIS CONTAINER USED ONLY FO
- Page 250 and 251: HC5. Main material of the exterior
- Page 252 and 253: HC10. DO YOU OR SOMEONE LIVING IN T
- Page 254 and 255: CHILD LABOURTo be administered for
- Page 256 and 257: DE-WORMINGTo be administered only f
- Page 258 and 259: CD9. Write the name and line number
- Page 260 and 261: HH19. Record the time.Hour and minu
- Page 262 and 263: Interviewer’s ObservationsField E
- Page 264 and 265: WOMAN’S BACKGROUNDWBWB1. IN WHAT
- Page 266 and 267: DESIRE OF LAST BIRTHDBThe questionn
- Page 268 and 269: MN9. DID YOU RECEIVE ANY TETANUS IN
- Page 270 and 271: MN20. WHEN (name) WAS BORN, WAS HE/
- Page 272 and 273: CONTRACEPTIONCP1. LET'S US TALK ABO
- Page 274 and 275:
UN9. Check CP2. Currently using a f
- Page 276 and 277:
ATTITUDES TOWARD DOMESTIC VIOLENCED
- Page 278 and 279:
HIV/AIDSHA1. NOW I WOULD LIKE TO TA
- Page 280 and 281:
HA19. Check MN17: Birth delivered b
- Page 282 and 283:
TA11. HAVE YOU CONSUMED ANY SMOKELE
- Page 284 and 285:
LS5. HOW SATISFIED ARE YOU WITH YOU
- Page 286 and 287:
Interviewer’s ObservationsField E
- Page 288 and 289:
UF12. Record the time.Hour and minu
- Page 290 and 291:
EC6. WITHIN THE LAST SEVEN DAYS, AB
- Page 292 and 293:
BREASTFEEDINGBF1. HAS (name) EVER B
- Page 294 and 295:
CARE OF ILLNESSCA1. IN THE LAST TWO
- Page 296 and 297:
CA9. WAS THE FAST OR DIFFICULT BREA
- Page 298 and 299:
ML8. WAS (name) GIVEN ANY MEDICINE
- Page 300 and 301:
IM5. HAS (name) BEEN ADMINISTERED A
- Page 302 and 303:
Child Grant (only for Humla, Jumla,
- Page 304:
Interviewer’s ObservationsField E


