- Page 1 and 2:
Volume No. 1Annual 18th Internation
- Page 3 and 4:
Research for Rural Development 2012
- Page 6 and 7:
ContentsFOOD SCIENCESVETERINARYMEDI
- Page 8 and 9:
AGRICULTURAL SCIENCES (CROP SCIENCE
- Page 10 and 11:
Mihails Vilcāns, Jūlija Volkova,
- Page 12 and 13:
Mihails Vilcāns, Jūlija Volkova,
- Page 14 and 15:
AGRICULTURAL SCIENCES (CROP SCIENCE
- Page 16:
Berit TeinEFFECT OF ORGANIC AND CON
- Page 19 and 20:
AGRICULTURAL SCIENCES (CROP SCIENCE
- Page 21 and 22:
Methane producing bacteria use only
- Page 23 and 24:
according to calculations the metha
- Page 25 and 26:
AGRICULTURAL SCIENCES (CROP SCIENCE
- Page 27 and 28:
CHANGES IN SUGAR CONTENT OF WINTERO
- Page 29 and 30:
CHANGES IN SUGAR CONTENT OF WINTERO
- Page 31 and 32:
CHANGES IN SUGAR CONTENT OF WINTERO
- Page 33 and 34:
PERENNIAL GRASSES FOR BIOENERGY PRO
- Page 35 and 36:
PERENNIAL GRASSES FOR BIOENERGY PRO
- Page 37 and 38:
PERENNIAL GRASSES FOR BIOENERGY PRO
- Page 39 and 40:
AGRICULTURAL SCIENCES (CROP SCIENCE
- Page 41 and 42:
IMPACT OF SLURRY APPLICATION METHOD
- Page 43 and 44:
IMPACT OF SLURRY APPLICATION METHOD
- Page 45 and 46:
AGRICULTURAL SCIENCES (CROP SCIENCE
- Page 47 and 48:
IMPACT OF ORGANIC PRODUCT EXTRACTS
- Page 49 and 50:
IMPACT OF ORGANIC PRODUCT EXTRACTS
- Page 51 and 52:
AGRICULTURAL SCIENCES (CROP SCIENCE
- Page 53 and 54:
COMBUSTION ABILITY OF ENERGY CROP P
- Page 55 and 56:
COMBUSTION ABILITY OF ENERGY CROP P
- Page 57 and 58:
AGRICULTURAL SCIENCES (CROP SCIENCE
- Page 59 and 60:
RESEARCH OF OREGANO (ORIGANUMVULGAR
- Page 61 and 62:
RESEARCH OF OREGANO (ORIGANUMVULGAR
- Page 63 and 64:
INFLUENCE OF SOIL MODIFICATION ON C
- Page 65 and 66:
INFLUENCE OF SOIL MODIFICATION ON C
- Page 67 and 68:
INFLUENCE OF SOIL MODIFICATION ON C
- Page 69 and 70:
INCIDENCE OF POSTHARVEST ROT OF CRA
- Page 71 and 72:
INCIDENCE OF POSTHARVEST ROT OF CRA
- Page 73 and 74:
AGRICULTURAL SCIENCES (CROP SCIENCE
- Page 75 and 76:
PERSPECTIVES ON TRUFFLE CULTIVATION
- Page 77 and 78:
PERSPECTIVES ON TRUFFLE CULTIVATION
- Page 79 and 80:
PERSPECTIVES ON TRUFFLE CULTIVATION
- Page 81 and 82:
FACTORS AFFECTING GOAT MILK YIELDAN
- Page 83 and 84:
FACTORS AFFECTING GOAT MILK YIELDAN
- Page 85 and 86:
FACTORS AFFECTING GOAT MILK YIELDAN
- Page 87 and 88:
MILK UREA CONTENT AS INDICATOR FEED
- Page 89 and 90:
MILK UREA CONTENT AS INDICATOR FEED
- Page 91 and 92:
MILK UREA CONTENT AS INDICATOR FEED
- Page 93 and 94:
REHYDRATION KINETICS OF DRIED LATVI
- Page 95 and 96:
REHYDRATION KINETICS OF DRIED LATVI
- Page 97 and 98:
REHYDRATION KINETICS OF DRIED LATVI
- Page 99 and 100:
FOOD SCIENCESPreliminary RESULTS of
- Page 101 and 102:
PRELIMINARY RESULTS OF 1-METHYLCYCL
- Page 103 and 104:
FOOD SCIENCESSensory PROPERTIES and
- Page 105 and 106: SENSORY PROPERTIES AND CHEMICAL COM
- Page 107 and 108: SENSORY PROPERTIES AND CHEMICAL COM
- Page 109 and 110: SENSORY PROPERTIES AND CHEMICAL COM
- Page 111 and 112: THE SUITABILITY OF DIFFERENT ROWANB
- Page 113 and 114: THE SUITABILITY OF DIFFERENT ROWANB
- Page 115 and 116: THE SUITABILITY OF DIFFERENT ROWANB
- Page 117 and 118: THE SUITABILITY OF DIFFERENT ROWANB
- Page 119 and 120: CHEMICAL COMPOSITION OF NEW TYPE AG
- Page 121 and 122: CHEMICAL COMPOSITION OF NEW TYPE AG
- Page 123 and 124: CHEMICAL COMPOSITION OF NEW TYPE AG
- Page 125 and 126: FOOD SCIENCESINFLUENCE OF GENOTYPE
- Page 127 and 128: INFLUENCE OF GENOTYPE AND HARVEST T
- Page 129 and 130: INFLUENCE OF GENOTYPE AND HARVEST T
- Page 131 and 132: INFLUENCE OF GENOTYPE AND HARVEST T
- Page 133 and 134: ROOT VEGETABLES FROM LATVIA:QUANTIT
- Page 135 and 136: ROOT VEGETABLES FROM LATVIA:QUANTIT
- Page 137 and 138: ROOT VEGETABLES FROM LATVIA:QUANTIT
- Page 139 and 140: CONTENT OF SUGARS, DIETARY FIBRE AN
- Page 141 and 142: CONTENT OF SUGARS, DIETARY FIBRE AN
- Page 143 and 144: CONTENT OF SUGARS, DIETARY FIBRE AN
- Page 145 and 146: RHEOLOGICAL PROPERTIES OF TRITICALE
- Page 147 and 148: RHEOLOGICAL PROPERTIES OF TRITICALE
- Page 149 and 150: RHEOLOGICAL PROPERTIES OF TRITICALE
- Page 151 and 152: acceptance and preference especiall
- Page 153 and 154: CONSUMERS’ ATTITUDE TOWARDS AVAIL
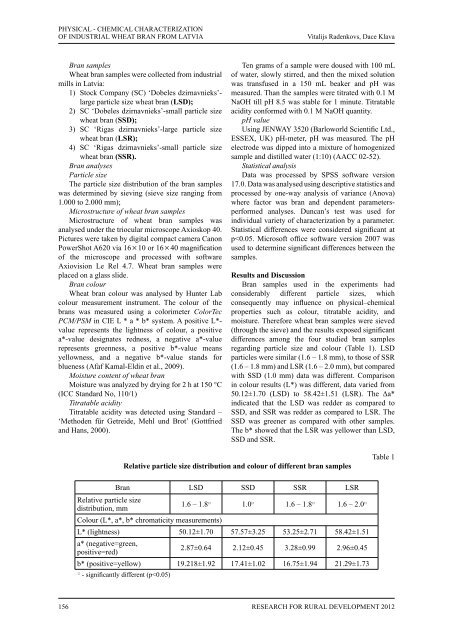
- Page 155: CONSUMERS’ ATTITUDE TOWARDS AVAIL
- Page 159 and 160: PHYSICAL - CHEMICAL CHARACTERIZATIO
- Page 161 and 162: FOOD SCIENCESTHE INFLUENCE OF DIFFE
- Page 163 and 164: THE INFLUENCE OF DIFFERENT SELENIUM
- Page 165 and 166: FOOD SCIENCESINVESTIGATIONS INTO TH
- Page 167 and 168: INVESTIGATIONS INTO THE ENHANCEMENT
- Page 169 and 170: INVESTIGATIONS INTO THE ENHANCEMENT
- Page 171 and 172: INVESTIGATIONS INTO THE ENHANCEMENT
- Page 173 and 174: INFLUENCE OF PACKAGING CONDITIONSON
- Page 175 and 176: INFLUENCE OF PACKAGING CONDITIONSON
- Page 177 and 178: FOOD SCIENCESFATTY ACID COMPOSITION
- Page 179 and 180: FATTY ACID COMPOSITION OF THE MEAT
- Page 181 and 182: FATTY ACID COMPOSITION OF THE MEAT
- Page 183 and 184: ANTIMICROBIAL RESISTANCE OFANIMAL P
- Page 185 and 186: ANTIMICROBIAL RESISTANCE OFANIMAL P
- Page 187 and 188: ANTIMICROBIAL RESISTANCE OFANIMAL P
- Page 189 and 190: VETERINARY MEDICINETHE SURVIVAL OF
- Page 191 and 192: THE SURVIVAL OF LISTERIA MONOCYTOGE
- Page 193 and 194: THE SURVIVAL OF LISTERIA MONOCYTOGE
- Page 195 and 196: THE SURVIVAL OF LISTERIA MONOCYTOGE
- Page 197 and 198: VETERINARY MEDICINEMicrobiological
- Page 199 and 200: MICROBIOLOGICAL QUALITY OF COWS’
- Page 201 and 202: MICROBIOLOGICAL QUALITY OF COWS’
- Page 203 and 204: MICROBIOLOGICAL QUALITY OF COWS’
- Page 205 and 206: PORCINE CIRCOVIRUS-2 IMPACT ON THEM
- Page 207 and 208:
PORCINE CIRCOVIRUS-2 IMPACT ON THEM
- Page 209 and 210:
PORCINE CIRCOVIRUS-2 IMPACT ON THEM
- Page 211 and 212:
PORCINE CIRCOVIRUS-2 IMPACT ON THEM
- Page 213 and 214:
AORTIC LUMEN DIAMETER AND BLOODPRES
- Page 215 and 216:
AORTIC LUMEN DIAMETER AND BLOODPRES
- Page 217 and 218:
AORTIC LUMEN DIAMETER AND BLOODPRES
- Page 219 and 220:
PHYSICAL MODEL OF TRACTOR IMPLEMENT
- Page 221 and 222:
PHYSICAL MODEL OF TRACTOR IMPLEMENT
- Page 223 and 224:
PHYSICAL MODEL OF TRACTOR IMPLEMENT
- Page 225 and 226:
SOLID FUEL BOILER AUTOMATION FOR BR
- Page 227 and 228:
SOLID FUEL BOILER AUTOMATION FOR BR
- Page 229 and 230:
SOLID FUEL BOILER AUTOMATION FOR BR
- Page 231 and 232:
INVESTMENT COSTS OPTIMIZATION OFMUL
- Page 233 and 234:
INVESTMENT COSTS OPTIMIZATION OFMUL
- Page 235 and 236:
DYNAMIC MODEL OF BIOCHEMICAL NETWOR
- Page 237 and 238:
DYNAMIC MODEL OF BIOCHEMICAL NETWOR
- Page 239 and 240:
EDUCATIONAL SCIENCESCHILDREN WITH S
- Page 241 and 242:
CHILDREN WITH SPECIAL NEEDS FAMILY
- Page 243 and 244:
CHILDREN WITH SPECIAL NEEDS FAMILY
- Page 245:
CHILDREN WITH SPECIAL NEEDS FAMILY