LATVIA UNIVERSITY OF AGRICULTURE - Latvijas ...
LATVIA UNIVERSITY OF AGRICULTURE - Latvijas ...
LATVIA UNIVERSITY OF AGRICULTURE - Latvijas ...
- No tags were found...

Create successful ePaper yourself
Turn your PDF publications into a flip-book with our unique Google optimized e-Paper software.
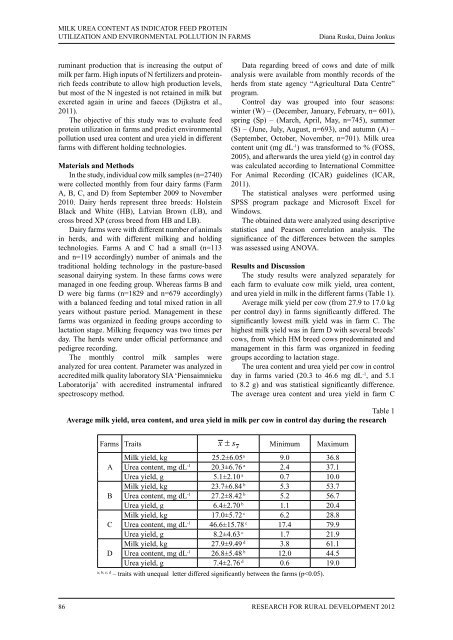
MILK UREA CONTENT AS INDICATOR FEED PROTEINUTILIZATION AND ENVIRONMENTAL POLLUTION IN FARMSDiana Ruska, Daina Jonkusruminant production that is increasing the output ofmilk per farm. High inputs of N fertilizers and proteinrichfeeds contribute to allow high production levels,but most of the N ingested is not retained in milk butexcreted again in urine and faeces (Dijkstra et al.,2011).The objective of this study was to evaluate feedprotein utilization in farms and predict environmentalpollution used urea content and urea yield in differentfarms with different holding technologies.Materials and MethodsIn the study, individual cow milk samples (n=2740)were collected monthly from four dairy farms (FarmA, B, C, and D) from September 2009 to November2010. Dairy herds represent three breeds: HolsteinBlack and White (HB), Latvian Brown (LB), andcross breed XP (cross breed from HB and LB).Dairy farms were with different number of animalsin herds, and with different milking and holdingtechnologies. Farms A and C had a small (n=113and n=119 accordingly) number of animals and thetraditional holding technology in the pasture-basedseasonal dairying system. In these farms cows weremanaged in one feeding group. Whereas farms B andD were big farms (n=1829 and n=679 accordingly)with a balanced feeding and total mixed ration in allyears without pasture period. Management in thesefarms was organized in feeding groups according tolactation stage. Milking frequency was two times perday. The herds were under official performance andpedigree recording.The monthly control milk samples wereanalyzed for urea content. Parameter was analyzed inaccredited milk quality laboratory SIA ‘PiensaimniekuLaboratorija’ with accredited instrumental infraredspectroscopy method.Data regarding breed of cows and date of milkanalysis were available from monthly records of theherds from state agency “Agricultural Data Centre”program.Control day was grouped into four seasons:winter (W) – (December, January, February, n= 601),spring (Sp) – (March, April, May, n=745), summer(S) – (June, July, August, n=693), and autumn (A) –(September, October, November, n=701). Milk ureacontent unit (mg dL -1 ) was transformed to % (FOSS,2005), and afterwards the urea yield (g) in control daywas calculated according to International CommitteeFor Animal Recording (ICAR) guidelines (ICAR,2011).The statistical analyses were performed usingSPSS program package and Microsoft Excel forWindows.The obtained data were analyzed using descriptivestatistics and Pearson correlation analysis. Thesignificance of the differences between the sampleswas assessed using ANOVA.Results and DiscussionThe study results were analyzed separately foreach farm to evaluate cow milk yield, urea content,and urea yield in milk in the different farms (Table 1).Average milk yield per cow (from 27.9 to 17.0 kgper control day) in farms significantly differed. Thesignificantly lowest milk yield was in farm C. Thehighest milk yield was in farm D with several breeds’cows, from which HM breed cows predominated andmanagement in this farm was organized in feedinggroups according to lactation stage.The urea content and urea yield per cow in controlday in farms varied (20.3 to 46.6 mg dL -1 , and 5.1to 8.2 g) and was statistical significantly difference.The average urea content and urea yield in farm CTable 1Average milk yield, urea content, and urea yield in milk per cow in control day during the researchFarms Traitsx ± sxMinimum MaximumMilk yield, kg 25.2±6.05 a 9.0 36.8A Urea content, mg dL -1 20.3±6.76 a 2.4 37.1Urea yield, g 5.1±2.10 a 0.7 10.0Milk yield, kg 23.7±6.84 b 5.3 53.7B Urea content, mg dL -1 27.2±8.42 b 5.2 56.7Urea yield, g 6.4±2.70 b 1.1 20.4Milk yield, kg 17.0±5.72 c 6.2 28.8C Urea content, mg dL -1 46.6±15.78 c 17.4 79.9Urea yield, g 8.2±4.63 c 1.7 21.9Milk yield, kg 27.9±9.49 d 3.8 61.1D Urea content, mg dL -1 26.8±5.48 b 12.0 44.5Urea yield, g 7.4±2.76 d 0.6 19.0a; b; c; d– traits with unequal letter differed significantly between the farms (p