LATVIA UNIVERSITY OF AGRICULTURE - Latvijas ...
LATVIA UNIVERSITY OF AGRICULTURE - Latvijas ...
LATVIA UNIVERSITY OF AGRICULTURE - Latvijas ...
- No tags were found...

Create successful ePaper yourself
Turn your PDF publications into a flip-book with our unique Google optimized e-Paper software.
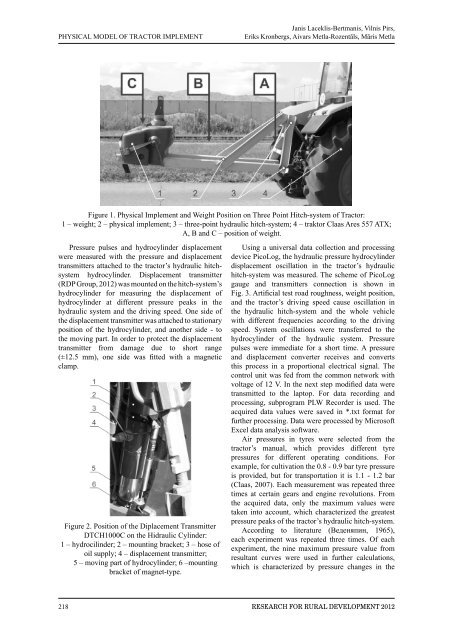
PHYSICAL MODEL <strong>OF</strong> TRACTOR IMPLEMENTJanis Laceklis-Bertmanis, Vilnis Pirs,Eriks Kronbergs, Aivars Metla-Rozentāls, Māris MetlaFigure 1. Physical Implement and Weight Position on Three Point Hitch-system of Tractor:1 – weight; 2 – physical implement; 3 – three-point hydraulic hitch-system; 4 – traktor Claas Ares 557 ATX;A, B and C – position of weight.Pressure pulses and hydrocylinder displacementwere measured with the pressure and displacementtransmitters attached to the tractor’s hydraulic hitchsystemhydrocylinder. Displacement transmitter(RDP Group, 2012) was mounted on the hitch-system’shydrocylinder for measuring the displacement ofhydrocylinder at different pressure peaks in thehydraulic system and the driving speed. One side ofthe displacement transmitter was attached to stationaryposition of the hydrocylinder, and another side - tothe moving part. In order to protect the displacementtransmitter from damage due to short range(±12.5 mm), one side was fitted with a magneticclamp.Figure 2. Position of the Diplacement TransmitterDTCH1000C on the Hidraulic Cylinder:1 – hydrocilinder; 2 – mounting bracket; 3 – hose ofoil supply; 4 – displacement transmitter;5 – moving part of hydrocylinder; 6 –mountingbracket of magnet-type.Using a universal data collection and processingdevice PicoLog, the hydraulic pressure hydrocylinderdisplacement oscillation in the tractor’s hydraulichitch-system was measured. The scheme of PicoLoggauge and transmitters connection is shown inFig. 3. Artificial test road roughness, weight position,and the tractor’s driving speed cause oscillation inthe hydraulic hitch-system and the whole vehiclewith different frequencies according to the drivingspeed. System oscillations were transferred to thehydrocylinder of the hydraulic system. Pressurepulses were immediate for a short time. A pressureand displacement converter receives and convertsthis process in a proportional electrical signal. Thecontrol unit was fed from the common network withvoltage of 12 V. In the next step modified data weretransmitted to the laptop. For data recording andprocessing, subprogram PLW Recorder is used. Theacquired data values were saved in *.txt format forfurther processing. Data were processed by MicrosoftExcel data analysis software.Air pressures in tyres were selected from thetractor’s manual, which provides different tyrepressures for different operating conditions. Forexample, for cultivation the 0.8 - 0.9 bar tyre pressureis provided, but for transportation it is 1.1 - 1.2 bar(Claas, 2007). Each measurement was repeated threetimes at certain gears and engine revolutions. Fromthe acquired data, only the maximum values weretaken into account, which characterized the greatestpressure peaks of the tractor’s hydraulic hitch-system.According to literature (Веденяпин, 1965),each experiment was repeated three times. Of eachexperiment, the nine maximum pressure value fromresultant curves were used in further calculations,which is characterized by pressure changes in the218 Research for Rural Development 2012