2008 Annual Report - SBM Offshore
2008 Annual Report - SBM Offshore
2008 Annual Report - SBM Offshore
- No tags were found...

Create successful ePaper yourself
Turn your PDF publications into a flip-book with our unique Google optimized e-Paper software.
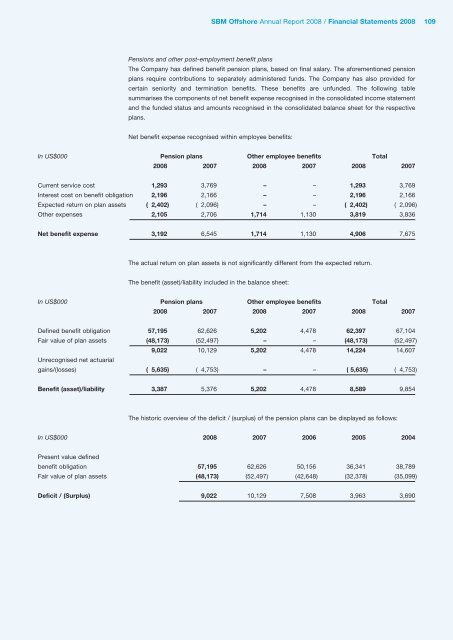
<strong>SBM</strong> <strong>Offshore</strong> <strong>Annual</strong> <strong>Report</strong> <strong>2008</strong> / Financial Statements <strong>2008</strong> 109Pensions and other post-employment benefit plansThe Company has defined benefit pension plans, based on final salary. The aforementioned pensionplans require contributions to separately administered funds. The Company has also provided forcertain seniority and termination benefits. These benefits are unfunded. The following tablesummarises the components of net benefit expense recognised in the consolidated income statementand the funded status and amounts recognised in the consolidated balance sheet for the respectiveplans.Net benefit expense recognised within employee benefits:In US$000 Pension plans Other employee benefits Total<strong>2008</strong> 2007 <strong>2008</strong> 2007 <strong>2008</strong> 2007Current service cost 1,293 3,769 – – 1,293 3,769Interest cost on benefit obligation 2,196 2,166 – – 2,196 2,166Expected return on plan assets ( 2,402) ( 2,096) – – ( 2,402) ( 2,096)Other expenses 2,105 2,706 1,714 1,130 3,819 3,836Net benefit expense 3,192 6,545 1,714 1,130 4,906 7,675The actual return on plan assets is not significantly different from the expected return.The benefit (asset)/liability included in the balance sheet:In US$000 Pension plans Other employee benefits Total<strong>2008</strong> 2007 <strong>2008</strong> 2007 <strong>2008</strong> 2007Defined benefit obligation 57,195 62,626 5,202 4,478 62,397 67,104Fair value of plan assets (48,173) (52,497) – – (48,173) (52,497)9,022 10,129 5,202 4,478 14,224 14,607Unrecognised net actuarialgains/(losses) ( 5,635) ( 4,753) – – ( 5,635) ( 4,753)Benefit (asset)/liability 3,387 5,376 5,202 4,478 8,589 9,854The historic overview of the deficit / (surplus) of the pension plans can be displayed as follows:In US$000 <strong>2008</strong> 2007 2006 2005 2004Present value definedbenefit obligation 57,195 62,626 50,156 36,341 38,789Fair value of plan assets (48,173) (52,497) (42,648) (32,378) (35,099)Deficit / (Surplus) 9,022 10,129 7,508 3,963 3,690