2008 Annual Report - SBM Offshore
2008 Annual Report - SBM Offshore
2008 Annual Report - SBM Offshore
- No tags were found...
Create successful ePaper yourself
Turn your PDF publications into a flip-book with our unique Google optimized e-Paper software.
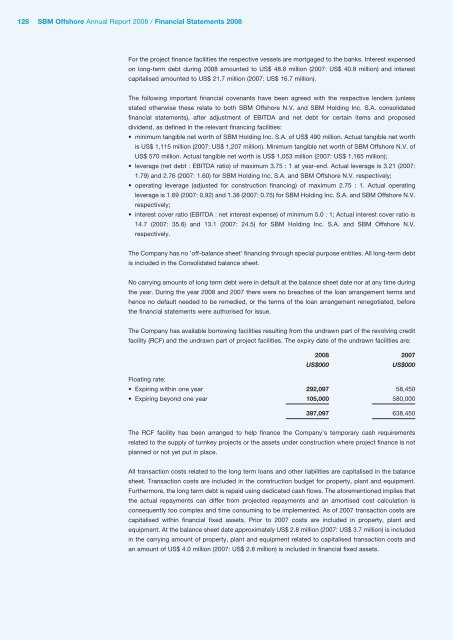
128 <strong>SBM</strong> <strong>Offshore</strong> <strong>Annual</strong> <strong>Report</strong> <strong>2008</strong> / Financial Statements <strong>2008</strong>For the project finance facilities the respective vessels are mortgaged to the banks. Interest expensedon long-term debt during <strong>2008</strong> amounted to US$ 48.8 million (2007: US$ 40.8 million) and interestcapitalised amounted to US$ 21.7 million (2007: US$ 16.7 million).The following important financial covenants have been agreed with the respective lenders (unlessstated otherwise these relate to both <strong>SBM</strong> <strong>Offshore</strong> N.V. and <strong>SBM</strong> Holding Inc. S.A. consolidatedfinancial statements), after adjustment of EBITDA and net debt for certain items and proposeddividend, as defined in the relevant financing facilities:• minimum tangible net worth of <strong>SBM</strong> Holding Inc. S.A. of US$ 490 million. Actual tangible net worthis US$ 1,115 million (2007: US$ 1,207 million). Minimum tangible net worth of <strong>SBM</strong> <strong>Offshore</strong> N.V. ofUS$ 570 million. Actual tangible net worth is US$ 1,053 million (2007: US$ 1,165 million);• leverage (net debt : EBITDA ratio) of maximum 3.75 : 1 at year-end. Actual leverage is 3.21 (2007:1.79) and 2.76 (2007: 1.60) for <strong>SBM</strong> Holding Inc. S.A. and <strong>SBM</strong> <strong>Offshore</strong> N.V. respectively;• operating leverage (adjusted for construction financing) of maximum 2.75 : 1. Actual operatingleverage is 1.69 (2007: 0.92) and 1.38 (2007: 0.75) for <strong>SBM</strong> Holding Inc. S.A. and <strong>SBM</strong> <strong>Offshore</strong> N.V.respectively;• interest cover ratio (EBITDA : net interest expense) of minimum 5.0 : 1; Actual interest cover ratio is14.7 (2007: 35.6) and 13.1 (2007: 24.5) for <strong>SBM</strong> Holding Inc. S.A. and <strong>SBM</strong> <strong>Offshore</strong> N.V.respectively.The Company has no ’off-balance sheet’ financing through special purpose entities. All long-term debtis included in the Consolidated balance sheet.No carrying amounts of long term debt were in default at the balance sheet date nor at any time duringthe year. During the year <strong>2008</strong> and 2007 there were no breaches of the loan arrangement terms andhence no default needed to be remedied, or the terms of the loan arrangement renegotiated, beforethe financial statements were authorised for issue.The Company has available borrowing facilities resulting from the undrawn part of the revolving creditfacility (RCF) and the undrawn part of project facilities. The expiry date of the undrawn facilities are:<strong>2008</strong> 2007US$000US$000Floating rate:• Expiring within one year 292,097 58,450• Expiring beyond one year 105,000 580,000397,097 638,450The RCF facility has been arranged to help finance the Company’s temporary cash requirementsrelated to the supply of turnkey projects or the assets under construction where project finance is notplanned or not yet put in place.All transaction costs related to the long term loans and other liabilities are capitalised in the balancesheet. Transaction costs are included in the construction budget for property, plant and equipment.Furthermore, the long term debt is repaid using dedicated cash flows. The aforementioned implies thatthe actual repayments can differ from projected repayments and an amortised cost calculation isconsequently too complex and time consuming to be implemented. As of 2007 transaction costs arecapitalised within financial fixed assets. Prior to 2007 costs are included in property, plant andequipment. At the balance sheet date approximately US$ 2.8 million (2007: US$ 3.7 million) is includedin the carrying amount of property, plant and equipment related to capitalised transaction costs andan amount of US$ 4.0 million (2007: US$ 2.8 million) is included in financial fixed assets.


