2008 Annual Report - SBM Offshore
2008 Annual Report - SBM Offshore
2008 Annual Report - SBM Offshore
- No tags were found...

You also want an ePaper? Increase the reach of your titles
YUMPU automatically turns print PDFs into web optimized ePapers that Google loves.
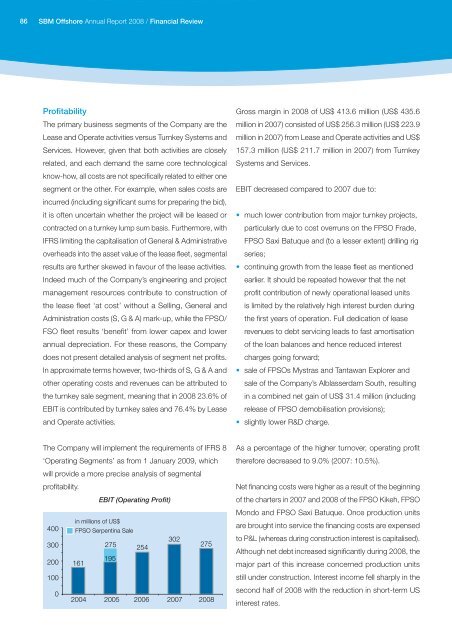
86 <strong>SBM</strong> <strong>Offshore</strong> <strong>Annual</strong> <strong>Report</strong> <strong>2008</strong> / Financial ReviewProfitabilityThe primary business segments of the Company are theLease and Operate activities versus Turnkey Systems andServices. However, given that both activities are closelyrelated, and each demand the same core technologicalknow-how, all costs are not specifically related to either onesegment or the other. For example, when sales costs areincurred (including significant sums for preparing the bid),it is often uncertain whether the project will be leased orcontracted on a turnkey lump sum basis. Furthermore, withIFRS limiting the capitalisation of General & Administrativeoverheads into the asset value of the lease fleet, segmentalresults are further skewed in favour of the lease activities.Indeed much of the Company’s engineering and projectmanagement resources contribute to construction ofthe lease fleet ‘at cost’ without a Selling, General andAdministration costs (S, G & A) mark-up, while the FPSO/FSO fleet results ‘benefit’ from lower capex and lowerannual depreciation. For these reasons, the Companydoes not present detailed analysis of segment net profits.In approximate terms however, two-thirds of S, G & A andother operating costs and revenues can be attributed tothe turnkey sale segment, meaning that in <strong>2008</strong> 23.6% ofEBIT is contributed by turnkey sales and 76.4% by Leaseand Operate activities.Gross margin in <strong>2008</strong> of US$ 413.6 million (US$ 435.6million in 2007) consisted of US$ 256.3 million (US$ 223.9million in 2007) from Lease and Operate activities and US$157.3 million (US$ 211.7 million in 2007) from TurnkeySystems and Services.EBIT decreased compared to 2007 due to:• much lower contribution from major turnkey projects,particularly due to cost overruns on the FPSO Frade,FPSO Saxi Batuque and (to a lesser extent) drilling rigseries;• continuing growth from the lease fleet as mentionedearlier. It should be repeated however that the netprofit contribution of newly operational leased unitsis limited by the relatively high interest burden duringthe first years of operation. Full dedication of leaserevenues to debt servicing leads to fast amortisationof the loan balances and hence reduced interestcharges going forward;• sale of FPSOs Mystras and Tantawan Explorer andsale of the Company’s Alblasserdam South, resultingin a combined net gain of US$ 31.4 million (includingrelease of FPSO demobilisation provisions);• slightly lower R&D charge.The Company will implement the requirements of IFRS 8‘Operating Segments’ as from 1 January 2009, whichwill provide a more precise analysis of segmentalprofitability.EBIT (Operating Profit)in millions of US$400300FPSO Serpentina Sale275302254275200 16119510002004 2005 2006 2007 <strong>2008</strong>As a percentage of the higher turnover, operating profittherefore decreased to 9.0% (2007: 10.5%).Net financing costs were higher as a result of the beginningof the charters in 2007 and <strong>2008</strong> of the FPSO Kikeh, FPSOMondo and FPSO Saxi Batuque. Once production unitsare brought into service the financing costs are expensedto P&L (whereas during construction interest is capitalised).Although net debt increased significantly during <strong>2008</strong>, themajor part of this increase concerned production unitsstill under construction. Interest income fell sharply in thesecond half of <strong>2008</strong> with the reduction in short-term USinterest rates.