2008 Annual Report - SBM Offshore
2008 Annual Report - SBM Offshore
2008 Annual Report - SBM Offshore
- No tags were found...

Create successful ePaper yourself
Turn your PDF publications into a flip-book with our unique Google optimized e-Paper software.
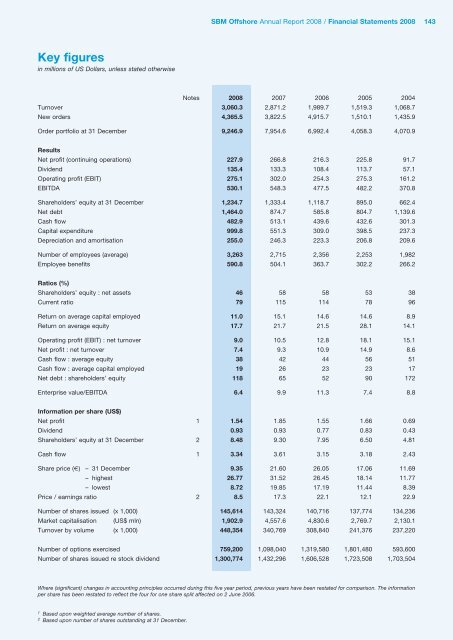
<strong>SBM</strong> <strong>Offshore</strong> <strong>Annual</strong> <strong>Report</strong> <strong>2008</strong> / Financial Statements <strong>2008</strong> 143Key figuresin millions of US Dollars, unless stated otherwiseNotes <strong>2008</strong> 2007 2006 2005 2004Turnover 3,060.3 2,871.2 1,989.7 1,519.3 1,068.7New orders 4,365.5 3,822.5 4,915.7 1,510.1 1,435.9Order portfolio at 31 December 9,246.9 7,954.6 6,992.4 4,058.3 4,070.9ResultsNet profit (continuing operations) 227.9 266.8 216.3 225.8 91.7Dividend 135.4 133.3 108.4 113.7 57.1Operating profit (EBIT) 275.1 302.0 254.3 275.3 161.2EBITDA 530.1 548.3 477.5 482.2 370.8Shareholders’ equity at 31 December 1,234.7 1,333.4 1,118.7 895.0 662.4Net debt 1,464.0 874.7 585.8 804.7 1,139.6Cash flow 482.9 513.1 439.6 432.6 301.3Capital expenditure 999.8 551.3 309.0 398.5 237.3Depreciation and amortisation 255.0 246.3 223.3 206.8 209.6Number of employees (average) 3,263 2,715 2,356 2,253 1,982Employee benefits 590.8 504.1 363.7 302.2 266.2Ratios (%)Shareholders’ equity : net assets 46 58 58 53 38Current ratio 79 115 114 78 96Return on average capital employed 11.0 15.1 14.6 14.6 8.9Return on average equity 17.7 21.7 21.5 28.1 14.1Operating profit (EBIT) : net turnover 9.0 10.5 12.8 18.1 15.1Net profit : net turnover 7.4 9.3 10.9 14.9 8.6Cash flow : average equity 38 42 44 56 51Cash flow : average capital employed 19 26 23 23 17Net debt : shareholders’ equity 118 65 52 90 172Enterprise value/EBITDA 6.4 9.9 11.3 7.4 8.8Information per share (US$)Net profit 1 1.54 1.85 1.55 1.66 0.69Dividend 0.93 0.93 0.77 0.83 0.43Shareholders’ equity at 31 December 2 8.48 9.30 7.95 6.50 4.81Cash flow 1 3.34 3.61 3.15 3.18 2.43Share price (€) – 31 December 9.35 21.60 26.05 17.06 11.69– highest 26.77 31.52 26.45 18.14 11.77– lowest 8.72 19.85 17.19 11.44 8.39Price / earnings ratio 2 8.5 17.3 22.1 12.1 22.9Number of shares issued (x 1,000) 145,614 143,324 140,716 137,774 134,236Market capitalisation (US$ mln) 1,902.9 4,557.6 4,830.6 2,769.7 2,130.1Turnover by volume (x 1,000) 448,354 340,769 308,840 241,376 237,220Number of options exercised 759,200 1,098,040 1,319,580 1,801,480 593,600Number of shares issued re stock dividend 1,300,774 1,432,296 1,606,528 1,723,508 1,703,504Where (significant) changes in accounting principles occurred during this five year period, previous years have been restated for comparison. The informationper share has been restated to reflect the four for one share split affected on 2 June 2006.1Based upon weighted average number of shares.2 Based upon number of shares outstanding at 31 December.