2008 Annual Report - SBM Offshore
2008 Annual Report - SBM Offshore
2008 Annual Report - SBM Offshore
- No tags were found...

Create successful ePaper yourself
Turn your PDF publications into a flip-book with our unique Google optimized e-Paper software.
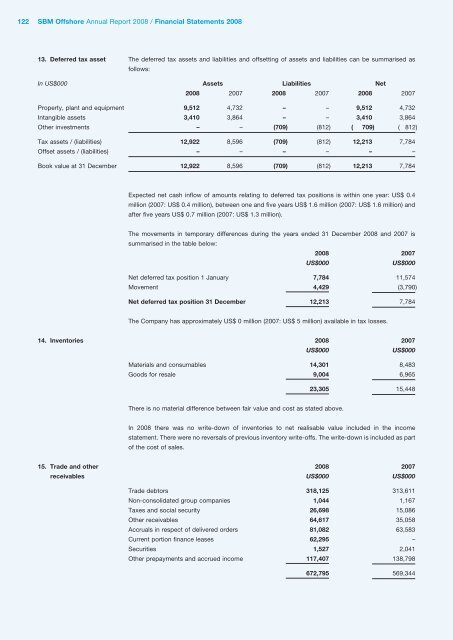
122 <strong>SBM</strong> <strong>Offshore</strong> <strong>Annual</strong> <strong>Report</strong> <strong>2008</strong> / Financial Statements <strong>2008</strong>13. Deferred tax asset The deferred tax assets and liabilities and offsetting of assets and liabilities can be summarised asfollows:In US$000 Assets Liabilities Net<strong>2008</strong> 2007 <strong>2008</strong> 2007 <strong>2008</strong> 2007Property, plant and equipment 9,512 4,732 – – 9,512 4,732Intangible assets 3,410 3,864 – – 3,410 3,864Other investments – – (709) (812) ( 709) ( 812)Tax assets / (liabilities) 12,922 8,596 (709) (812) 12,213 7,784Offset assets / (liabilities) – – – – – –Book value at 31 December 12,922 8,596 (709) (812) 12,213 7,784Expected net cash inflow of amounts relating to deferred tax positions is within one year: US$ 0.4million (2007: US$ 0.4 million), between one and five years US$ 1.6 million (2007: US$ 1.6 million) andafter five years US$ 0.7 million (2007: US$ 1.3 million).The movements in temporary differences during the years ended 31 December <strong>2008</strong> and 2007 issummarised in the table below:<strong>2008</strong> 2007US$000US$000Net deferred tax position 1 January 7,784 11,574Movement 4,429 (3,790)Net deferred tax position 31 December 12,213 7,784The Company has approximately US$ 0 million (2007: US$ 5 million) available in tax losses.14. Inventories <strong>2008</strong> 2007US$000US$000Materials and consumables 14,301 8,483Goods for resale 9,004 6,96523,305 15,448There is no material difference between fair value and cost as stated above.In <strong>2008</strong> there was no write-down of inventories to net realisable value included in the incomestatement. There were no reversals of previous inventory write-offs. The write-down is included as partof the cost of sales.15. Trade and other <strong>2008</strong> 2007receivables US$000 US$000Trade debtors 318,125 313,611Non-consolidated group companies 1,044 1,167Taxes and social security 26,698 15,086Other receivables 64,617 35,058Accruals in respect of delivered orders 81,082 63,583Current portion finance leases 62,295 –Securities 1,527 2,041Other prepayments and accrued income 117,407 138,798672,795 569,344