2008 Annual Report - SBM Offshore
2008 Annual Report - SBM Offshore
2008 Annual Report - SBM Offshore
- No tags were found...

You also want an ePaper? Increase the reach of your titles
YUMPU automatically turns print PDFs into web optimized ePapers that Google loves.
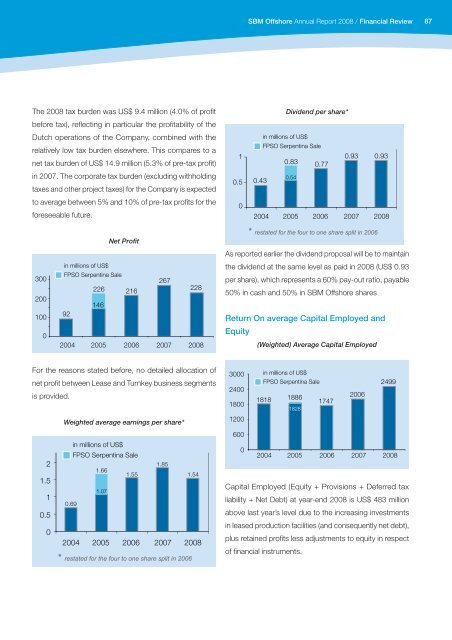
<strong>SBM</strong> <strong>Offshore</strong> <strong>Annual</strong> <strong>Report</strong> <strong>2008</strong> / Financial Review87The <strong>2008</strong> tax burden was US$ 9.4 million (4.0% of profitbefore tax), reflecting in particular the profitability of theDutch operations of the Company, combined with therelatively low tax burden elsewhere. This compares to anet tax burden of US$ 14.9 million (5.3% of pre-tax profit)in 2007. The corporate tax burden (excluding withholdingtaxes and other project taxes) for the Company is expectedto average between 5% and 10% of pre-tax profits for theforeseeable future.10.50Dividend per share*in millions of US$FPSO Serpentina Sale0.93 0.930.83 0.770.430.542004 2005 2006 2007 <strong>2008</strong>Net Profit3002001000in millions of US$FPSO Serpentina Sale267226 216228146922004 2005 2006 2007 <strong>2008</strong>As reported earlier the dividend proposal will be to maintainthe dividend at the same level as paid in <strong>2008</strong> (US$ 0.93per share), which represents a 60% pay-out ratio, payable50% in cash and 50% in <strong>SBM</strong> <strong>Offshore</strong> sharesReturn On average Capital Employed andEquity(Weighted) Average Capital EmployedFor the reasons stated before, no detailed allocation ofnet profit between Lease and Turnkey business segmentsis provided.Weighted average earnings per share*in millions of US$21.51FPSO Serpentina Sale1.851.661.551.541.070.690.502004 2005 2006 2007 <strong>2008</strong>3000 in millions of US$FPSO Serpentina Sale249924001818 18862006180017471828120060002004 2005 2006 2007 <strong>2008</strong>Capital Employed (Equity + Provisions + Deferred taxliability + Net Debt) at year-end <strong>2008</strong> is US$ 483 millionabove last year’s level due to the increasing investmentsin leased production facilities (and consequently net debt),plus retained profits less adjustments to equity in respectof financial instruments.