<strong>SBM</strong> <strong>Offshore</strong> <strong>Annual</strong> <strong>Report</strong> <strong>2008</strong> / Overview7In support of all the above, another steady activity whichrepresents a substantial element in the Company’sbusiness is the provision of specialised services such asmaintenance, spare parts, repairs and offshore installation.This forms an essential complement to the sales of facilities,offering to clients a comprehensive and integrated service.The Company has added the LNG FPSO to its productline to respond to the expected future demand for offshoreproduction of LNG from stranded gas fields.Strategy and organisation<strong>SBM</strong> <strong>Offshore</strong> currently operates from four main executioncentres: Engineering and Project Management resourcesare located in Schiedam, Monaco, Houston and KualaLumpur with regional management supported by corporatefunctions. The operation of the leased production/storageunits is managed by region and supported from Monacoand corporate functions are located in each of Schiedam,Marly (Switzerland) and Monaco. In addition to these maincentres, the Company is present in several countries forregional marketing and sales, local management of offshoreoperations and construction activities.The Company sells or leases offshore facilities generallyby outsourcing all hardware components and constructionservices. Therefore, it does not own any manufacturingplant, construction yard or shipyard with the exceptionof a partially owned construction yard currently beingbuilt in Angola. However, it possesses in-house all theengineering, project management and offshore installationcompetencies to execute large complex systems, withouthaving to rely on external resources, except for the LNGFPSO topsides, as explained later.In respect of the Company’s activities including both thesales of facilities and the lease and operate activities, thereis a set of established and centrally controlled financialand strategic rules as well as a Group ManagementSystem defining the Company procedures. The Company’sCorporate Engineering Standards ensure a commondesign approach in the four execution centres and facilitatethe optimal use of the skills and global resources availablefor the execution of large and complex projects.The corporate culture is characterised by market-orientedtechnology innovation. <strong>SBM</strong> <strong>Offshore</strong> is a trendsetter in thedevelopment of new cost-saving solutions which optimallyrespond to clients’ changing needs. In order to protect andexpand its leading market position, it devotes significantattention to research, development, and the protectionof Intellectual Property, as well as to the management offinancial and technical risks.The ‘Normand Installer’ in action during hookup at FPSO Espirito Santo in Brazil
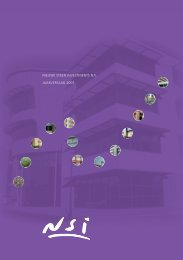
8 <strong>SBM</strong> <strong>Offshore</strong> <strong>Annual</strong> <strong>Report</strong> <strong>2008</strong> / OverviewSnapshot <strong>2008</strong>Item (US$ mln) <strong>2008</strong> 2007 Movement % CommentNet profit 227.9 266.8 (38.9) (14.6) Operational profits down in TurnkeyPer share (US$) 1.54 1.85 (0.31) (16.8) Operational profits down in TurnkeyEBIT 275.1 302.0 (26.9) (8.9) Expanding lease fleet; Turnkey cost overrunsEBITDA 530.1 548.3 (18.2) (3.3) Expanding lease fleet; Turnkey cost overrunsEnterprise value (EV) 3,366.8 5,432.3 (2,065.5) (38.0) Market capitalisation down; net debt increasedNet debt 1,464.0 874.7 589.3 67.4 Lease fleet investments require new debtNet Debt: EBITDA 2.76 1.60 1.16 72.5 Comfortably within bank covenantsEV : EBITDA 6.4 9.9 (3.5) (35.4) EV downTurnover 3,060.3 2,871.2 189.1 6.6 Lease and operate revenue upEBIT: Turnover (%) 9.0 10.5 (1.5) (14.3) Turnkey margins sufferedCash flow 482.9 513.1 (30.2) (5.9) Expanding lease fleet; Turnkey cost overrunsPer share (US$) 3.34 3.61 (0.27) (7.5)Net cash 230.1 274.1 (44.0) (16.1) Comfortable levelCapital expenditure 999.8 551.3 448.5 81.4 High level of investment in operating leasesTotal Equity 1,240.9 1,337.7 (96.8) (7.2) Mark to market of hedge portfolio reduced equityCapital employed 2,740.9 2,257.4 483.5 21.4 Net debt increasedROACE (%) 11.0 15.1 (4.1) (27.2) EBIT down; average capital employed increasedROE (%) 17.7 21.7 (4.0) (18.4) Net profit down, average equity downNet Debt: Equity (%) 118.0 65.4 52.6 80.4 Well within target rangeEBITDA interest cover 13.1 24.5 (11.4) (46.5) Higher net interest chargeNew orders:- Leases 1,437.8 1,936.5 (498.7) (25.8) One major lease contract- Turnkey 2,927.7 1,886.1 1,041.6 55.2 Includes two complex FPSOsBacklog:- Leases 6,278.0 5,650.3 627.7 11.1 A new record- Turnkey 2,968.9 2,304.3 664.6 28.8 Over 1 year equivalent turnoverShare price 31/12 (€) 9.35 21.60 (12.25) (56.7)AEX-index 245.9 515.8 (269.9) (52.3)Market capitalisation (€) 1,361.3 3,095.8 (1,734.5) (56.0) Share price fallMarket capitalisation (US$) 1,902.9 4,557.6 2,654.7 (58.2) Share price fall and € weakened against US$Proposed dividend (US$) 0.93 0.93 - - Maintained at prior year level