- Page 1 and 2:
EAT FOR HEALTHAustralianDietaryGuid
- Page 3 and 4:
© Commonwealth of Australia 2013Pa
- Page 6:
Australian Dietary GuidelinesGuidel
- Page 9 and 10:
GUIDELINE 2• Enjoy a wide variety
- Page 11 and 12:
guideline 5• Food safety 975.1 Se
- Page 13 and 14:
Table A2: Mean daily intakes of ene
- Page 15 and 16:
More recent evidence from Western s
- Page 17 and 18:
Relationship between the documents
- Page 19 and 20:
In this way, the Evidence Report wa
- Page 21 and 22:
Challenges for adoption of the Guid
- Page 23 and 24:
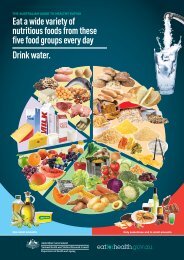
Australian Guide to Healthy EatingA
- Page 25 and 26:
Guideline 11.1 Setting the sceneA h
- Page 27 and 28:
Guideline 1UnderweightWhile the gre
- Page 29 and 30:
Guideline 1Figure 1.2: Mean energy
- Page 32 and 33:
Evidence statementBabies born to mo
- Page 34 and 35:
• Childhood weight gain: There is
- Page 36 and 37:
Given the scope of the Guidelines,
- Page 38 and 39:
Appropriate steady weight gain duri
- Page 40 and 41:
Dietary restriction beyond prudent
- Page 42:
1.5 Practice guide for Guideline 1T
- Page 45 and 46:
2.1 Enjoy a wide variety of nutriti
- Page 47 and 48:
Pregnant and breastfeeding womenCon
- Page 49 and 50:
2.2 Enjoy plenty of vegetables, inc
- Page 51 and 52:
• Prostate cancer: The evidence s
- Page 53 and 54:
The following studies relate primar
- Page 55 and 56:
Dietary fibre from vegetables and f
- Page 57 and 58:
Children and adolescentsThe recomme
- Page 59 and 60:
Cancer• Colorectal cancer: There
- Page 61 and 62:
Based on current consumption data,
- Page 63 and 64:
disaggregate possibly different eff
- Page 65 and 66: CancerNo recent studies investigati
- Page 67 and 68: Based on most recent consumption da
- Page 69 and 70: 2.5 Enjoy milk, yoghurt, cheese and
- Page 71 and 72: Other conditionsThe traditional nut
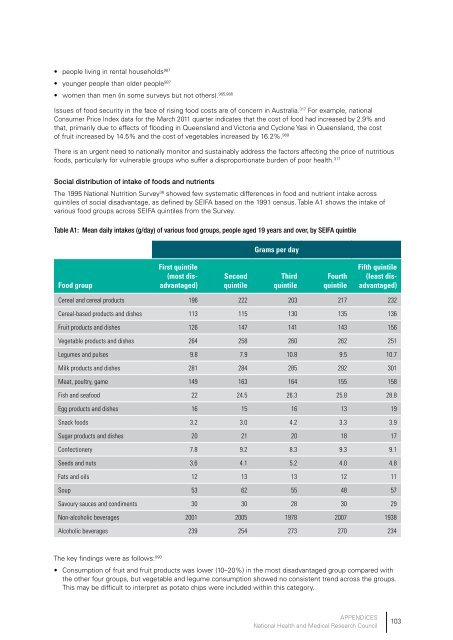
- Page 73 and 74: The 1995 National Nutrition Survey
- Page 75 and 76: Reviews have also shown an associat
- Page 77 and 78: 2.7 Practice guide for Guideline 2T
- Page 80 and 81: GUIDELINE 3Limit intake of foods co
- Page 82 and 83: 3.1.2 The evidence for ‘limit int
- Page 84 and 85: 3.1.3 How limiting intake of foods
- Page 86 and 87: InfantsFor infants under the age of
- Page 88 and 89: Bone healthEvidence suggesting an a
- Page 90 and 91: 3.3.2 The evidence for ‘limit int
- Page 92 and 93: 3.3.4 Practical considerations: lim
- Page 94 and 95: 3.4.2 The evidence for ‘limit int
- Page 96 and 97: 3.4.3 How limiting intake of alcoho
- Page 98: 3.5 Practice guide for Guideline 3T
- Page 101 and 102: 4.1 Setting the sceneThe World Heal
- Page 103 and 104: 4.2.1 Breastfeeding incidence and d
- Page 105 and 106: 4.2.3 Cardiovascular disease and ex
- Page 107 and 108: Lower socioeconomic status mothersW
- Page 109 and 110: 4.4 Practice guide for Guideline 4T
- Page 111 and 112: 5.1 Setting the sceneFoodborne illn
- Page 113 and 114: 5.4.2 InfantsThe immune system of i
- Page 115: A1Social distribution of diet-relat
- Page 119 and 120: Food intake, diet and nutritional s
- Page 121 and 122: The prevalence of health risk facto
- Page 123 and 124: Table B2: Members of the Working Co
- Page 125 and 126: The evidence was assessed according
- Page 127 and 128: As part of the consultation process
- Page 129 and 130: Expert reviewThe Guidelines underwe
- Page 131 and 132: 1995 - The Core Food GroupsThe Core
- Page 133 and 134: Appendix DQuestions for the literat
- Page 135 and 136: Umbrella review questions1. What di
- Page 137 and 138: Appendix ESummary of evidence state
- Page 139 and 140: Evidence statementGradeFruitThe eff
- Page 141 and 142: Limited - no conclusionEvidence is
- Page 143 and 144: Appendix GFood, nutrition and envir
- Page 145 and 146: Figure G1: Examples of environmenta
- Page 147 and 148: G4Australia’s progress toward a s
- Page 149 and 150: It is suggested that by 2011, 125 c
- Page 151 and 152: Appendix IPhysical activity guideli
- Page 153 and 154: Appendix JStudies examining the hea
- Page 155 and 156: Appendix KAlcohol and energy intake
- Page 157 and 158: Cholesterol: Cholesterol, chemicall
- Page 159 and 160: Limit: Limit is used to emphasise t
- Page 161 and 162: Salt: Dietary salt is an inorganic
- Page 164 and 165: Acronyms and abbreviationsADHDAIDSA
- Page 166 and 167:
References1. Rayner M, Scarborough
- Page 168 and 169:
37. National Health and Medical Res
- Page 170 and 171:
75. Taveras EM, Berkey CS, Rifas-Sh
- Page 172 and 173:
112. Olds TS, Tomkinson GR, Ferrar
- Page 174 and 175:
153. Rangan AM, Schindeler S, Hecto
- Page 176 and 177:
192. Stookey JD, Constant F, Gardne
- Page 178 and 179:
231. Hyson DA, Schneeman BO, Davis
- Page 180 and 181:
271. Marks GC, Coyne C, Pang G. Typ
- Page 182 and 183:
312. Cunningham J, O’Dea K, Dunba
- Page 184 and 185:
355. Burns C, Inglis A. Measuring f
- Page 186 and 187:
392. Harland JI, Haffner TA. System
- Page 188 and 189:
433. Northern Territory Government.
- Page 190 and 191:
473. Aune D, Chan DSM, Lau R, Vieir
- Page 192 and 193:
512. Ness A, Maynard M, Frankel S,
- Page 194 and 195:
550. Vislocky LM, Pikosky MA, Rubin
- Page 196 and 197:
588. Sellers TA, Vierkant RA, Djeu
- Page 198 and 199:
628. Rosner SA, Åkesson A, Stampfe
- Page 200 and 201:
669. Siri-Tarino PW, Sun Q, Hu FB,
- Page 202 and 203:
705. Mamalakis G, Kiriakakis M, Tsi
- Page 204 and 205:
743. Cook NR, Cutler JA, Obarzanek
- Page 206 and 207:
782. Balakrishnan M, Simmonds RS, T
- Page 208 and 209:
820. Newcomb PA, Nichols HB, Beasle
- Page 210 and 211:
862. Australian Institute of Health
- Page 212 and 213:
903. Romero-Gutiérrez G, Vaca-Orti
- Page 214 and 215:
942. Käferstein F, Abdussalam M. F
- Page 216 and 217:
985. Centre for Epidemiology and Re
- Page 218 and 219:
1025. Lee A, Bonson A, Yarmirr D, O
- Page 220 and 221:
1066. Natural Resource Management M
- Page 222 and 223:
1106. Liu Y, Sobue T, Otani T, Tsug
- Page 224 and 225:
Notes
- Page 226:
www.nhmrc.gov.auwww.eatforhealth.go