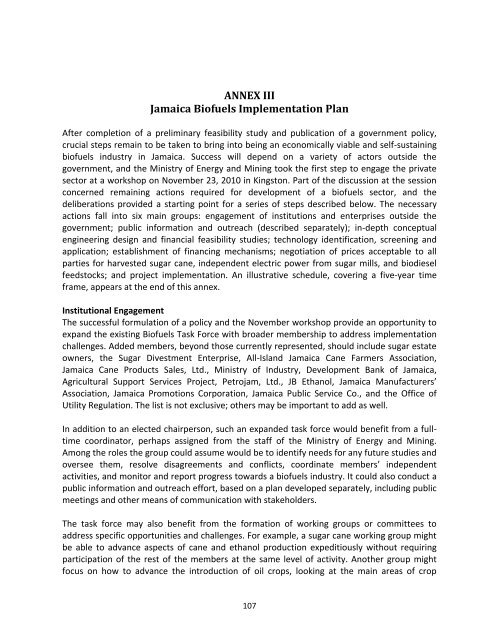
Financial Analysis for 15 Million Gallons per Year Biodiesel With TaxesYEARItem 0 1 2 3 4 5 6 7 8 9 10 11 12 13 14 151 Initial Investment $15,000,000234 Product Value per Gal. Biodiesel $2.57 $2.65 $2.73 $2.81 $2.89 $2.98 $3.07 $3.16 $3.26 $3.36 $3.46 $3.56 $3.67 $3.78 $3.895 Feedstock Cost per Gallon $1.93 $1.99 $2.05 $2.11 $2.17 $2.24 $2.30 $2.37 $2.44 $2.52 $2.59 $2.67 $2.75 $2.83 $2.926 Biodiesel Sales $38,574,550 $39,731,786 $40,923,740 $42,151,452 $43,415,996 $44,718,476 $46,060,030 $47,441,831 $48,865,086 $50,331,038 $51,840,970 $53,396,199 $54,998,085 $56,648,027 $58,347,4687 Feedstock cost @1.02 gal/gal prod. $29,508,699 $30,393,960 $31,305,779 $32,244,952 $33,212,301 $34,208,670 $35,234,930 $36,291,978 $37,380,737 $38,502,159 $39,657,224 $40,846,940 $42,072,349 $43,334,519 $44,634,5558 Gross Margin $9,065,851 $9,337,827 $9,617,961 $9,906,500 $10,203,695 $10,509,806 $10,825,100 $11,149,853 $11,484,349 $11,828,879 $12,183,746 $12,549,258 $12,925,736 $13,313,508 $13,712,9139 Gross margin per gallon $0.60 $0.62 $0.64 $0.66 $0.68 $0.70 $0.72 $0.74 $0.77 $0.79 $0.81 $0.84 $0.86 $0.89 $0.911011 Processing Cost12 Methanol and other reagents @ $0.25/ Gal. $3,750,000 $3,862,500 $3,978,375 $4,097,726 $4,220,658 $4,347,278 $4,477,696 $4,612,027 $4,750,388 $4,892,899 $5,039,686 $5,190,877 $5,346,603 $5,507,001 $5,672,21113 Other Plant Operating Cost @ $0.15/Gal. $2,250,000 $2,317,500 $2,387,025 $2,458,636 $2,532,395 $2,608,367 $2,686,618 $2,767,216 $2,850,233 $2,935,740 $3,023,812 $3,114,526 $3,207,962 $3,304,201 $3,403,32714 SG&A $500,000 $515,000 $530,450 $546,364 $562,754 $579,637 $597,026 $614,937 $633,385 $652,387 $671,958 $692,117 $712,880 $734,267 $756,29515 Total Processing Cost $6,500,000 $6,695,000 $6,895,850 $7,102,726 $7,315,807 $7,535,281 $7,761,340 $7,994,180 $8,234,006 $8,481,026 $8,735,456 $8,997,520 $9,267,446 $9,545,469 $9,831,8331617 Depreciation (15 year) $1,000,000 $1,000,000 $1,000,000 $1,000,000 $1,000,000 $1,000,000 $1,000,000 $1,000,000 $1,000,000 $1,000,000 $1,000,000 $1,000,000 $1,000,000 $1,000,000 $1,000,0001819 Net Income $1,565,851 $1,642,827 $1,722,111 $1,803,775 $1,887,888 $1,974,525 $2,063,760 $2,155,673 $2,250,343 $2,347,854 $2,448,289 $2,551,738 $2,658,290 $2,768,039 $2,881,0802021 Taxes (20%) $313,170 $328,565 $344,422 $360,755 $377,578 $394,905 $412,752 $431,135 $450,069 $469,571 $489,658 $510,348 $531,658 $553,608 $576,2162223 Income After Tax $1,252,681 $1,314,261 $1,377,689 $1,443,020 $1,510,310 $1,579,620 $1,651,008 $1,724,539 $1,800,275 $1,878,283 $1,958,631 $2,041,390 $2,126,632 $2,214,431 $2,304,86424 (Add Back Non-cash Depreciation) $1,000,000 $1,000,000 $1,000,000 $1,000,000 $1,000,000 $1,000,000 $1,000,000 $1,000,000 $1,000,000 $1,000,000 $1,000,000 $1,000,000 $1,000,000 $1,000,000 $1,000,00025 Cash Flow -$15,000,000 $2,252,681 $2,314,261 $2,377,689 $2,443,020 $2,510,310 $2,579,620 $2,651,008 $2,724,539 $2,800,275 $2,878,283 $2,958,631 $3,041,390 $3,126,632 $3,214,431 $3,304,86426 Discounted Cash Flow -$15,000,000 $1,958,853 $1,749,914 $1,563,369 $1,396,805 $1,248,068 $1,115,241 $996,612 $890,657 $796,013 $711,468 $635,938 $568,458 $508,165 $454,291 $406,15027 Cumulative Disc. Cash Flow -$15,000,000 -$13,041,147 -$11,291,233 -$9,727,864 -$8,331,059 -$7,082,991 -$5,967,750 -$4,971,138 -$4,080,482 -$3,284,469 -$2,573,001 -$1,937,064 -$1,368,606 -$860,441 -$406,150 $0INPUTSVALUES1 Investment per Annual Gallon $1.004 Product Annual Escallation Rate = 3%5 Feedstock Annual Escallation Rate = 3%12-14 Processing Annual Escallation Rate = 3%26 Annual Discount Rate (IRR) = 15%Financial Analysis for 15 Million Gallons per Year Biodiesel Without TaxesYEARItem 0 1 2 3 4 5 6 7 8 9 10 11 12 13 14 151 Initial Investment $15,000,000234 Product Value per Gal. Biodiesel $3.65 $3.76 $3.87 $3.99 $4.11 $4.23 $4.36 $4.49 $4.62 $4.76 $4.91 $5.05 $5.20 $5.36 $5.525 Feedstock Cost per Gallon $2.99 $3.08 $3.17 $3.26 $3.36 $3.46 $3.57 $3.67 $3.78 $3.90 $4.01 $4.13 $4.26 $4.38 $4.526 Biodiesel Sales $54,750,000 $56,392,500 $58,084,275 $59,826,803 $61,621,607 $63,470,256 $65,374,363 $67,335,594 $69,355,662 $71,436,332 $73,579,422 $75,786,804 $78,060,409 $80,402,221 $82,814,2877 Feedstock cost @1.02 gal/gal prod. $45,684,149 $47,054,673 $48,466,314 $49,920,303 $51,417,912 $52,960,449 $54,549,263 $56,185,741 $57,871,313 $59,607,452 $61,395,676 $63,237,546 $65,134,673 $67,088,713 $69,101,3748 Gross Margin $9,065,851 $9,337,827 $9,617,961 $9,906,500 $10,203,695 $10,509,806 $10,825,100 $11,149,853 $11,484,349 $11,828,879 $12,183,746 $12,549,258 $12,925,736 $13,313,508 $13,712,9139 Gross margin per gallon $0.60 $0.62 $0.64 $0.66 $0.68 $0.70 $0.72 $0.74 $0.77 $0.79 $0.81 $0.84 $0.86 $0.89 $0.911011 Processing Cost12 Methanol and other reagents @ $0.25/ Gal. $3,750,000 $3,862,500 $3,978,375 $4,097,726 $4,220,658 $4,347,278 $4,477,696 $4,612,027 $4,750,388 $4,892,899 $5,039,686 $5,190,877 $5,346,603 $5,507,001 $5,672,21113 Other Plant Operating Cost @ $0.15/Gal. $2,250,000 $2,317,500 $2,387,025 $2,458,636 $2,532,395 $2,608,367 $2,686,618 $2,767,216 $2,850,233 $2,935,740 $3,023,812 $3,114,526 $3,207,962 $3,304,201 $3,403,32714 SG&A $500,000 $515,000 $530,450 $546,364 $562,754 $579,637 $597,026 $614,937 $633,385 $652,387 $671,958 $692,117 $712,880 $734,267 $756,29515 Total Processing Cost $6,500,000 $6,695,000 $6,895,850 $7,102,726 $7,315,807 $7,535,281 $7,761,340 $7,994,180 $8,234,006 $8,481,026 $8,735,456 $8,997,520 $9,267,446 $9,545,469 $9,831,8331617 Depreciation (15 year) $1,000,000 $1,000,000 $1,000,000 $1,000,000 $1,000,000 $1,000,000 $1,000,000 $1,000,000 $1,000,000 $1,000,000 $1,000,000 $1,000,000 $1,000,000 $1,000,000 $1,000,0001819 Net Income $1,565,851 $1,642,827 $1,722,111 $1,803,775 $1,887,888 $1,974,525 $2,063,760 $2,155,673 $2,250,343 $2,347,854 $2,448,289 $2,551,738 $2,658,290 $2,768,039 $2,881,0802021 Taxes (20%) $313,170 $328,565 $344,422 $360,755 $377,578 $394,905 $412,752 $431,135 $450,069 $469,571 $489,658 $510,348 $531,658 $553,608 $576,2162223 Income After Tax $1,252,681 $1,314,261 $1,377,689 $1,443,020 $1,510,310 $1,579,620 $1,651,008 $1,724,539 $1,800,275 $1,878,283 $1,958,631 $2,041,390 $2,126,632 $2,214,431 $2,304,86424 (Add Back Non-cash Depreciation) $1,000,000 $1,000,000 $1,000,000 $1,000,000 $1,000,000 $1,000,000 $1,000,000 $1,000,000 $1,000,000 $1,000,000 $1,000,000 $1,000,000 $1,000,000 $1,000,000 $1,000,00025 Cash Flow -$15,000,000 $2,252,681 $2,314,261 $2,377,689 $2,443,020 $2,510,310 $2,579,620 $2,651,008 $2,724,539 $2,800,275 $2,878,283 $2,958,631 $3,041,390 $3,126,632 $3,214,431 $3,304,86426 Discounted Cash Flow -$15,000,000 $1,958,853 $1,749,914 $1,563,369 $1,396,805 $1,248,068 $1,115,241 $996,612 $890,657 $796,013 $711,468 $635,938 $568,458 $508,165 $454,291 $406,15027 Cumulative Disc. Cash Flow -$15,000,000 -$13,041,147 -$11,291,233 -$9,727,864 -$8,331,059 -$7,082,991 -$5,967,750 -$4,971,138 -$4,080,482 -$3,284,469 -$2,573,001 -$1,937,064 -$1,368,606 -$860,441 -$406,150 $0INPUTSVALUES1 Investment per Annual Gallon $1.004 Product Annual Escallation Rate = 3%5 Feedstock Annual Escallation Rate = 3%12-14 Processing Annual Escallation Rate = 3%26 Annual Discount Rate (IRR) = 15%106
ANNEX III<strong>Jamaica</strong> <strong>Bi<strong>of</strong>uels</strong> Implementation PlanAfter completion <strong>of</strong> a preliminary feasibility study and publication <strong>of</strong> a government policy,crucial steps remain to be taken to bring into being an economically viable and self-sustainingbi<strong>of</strong>uels industry in <strong>Jamaica</strong>. Success will depend on a variety <strong>of</strong> actors outside thegovernment, and the <strong>Ministry</strong> <strong>of</strong> <strong>Energy</strong> and Mining took the first step to engage the privatesector at a workshop on November 23, 2010 in Kingston. Part <strong>of</strong> the discussion at the sessionconcerned remaining actions required for development <strong>of</strong> a bi<strong>of</strong>uels sector, and thedeliberations provided a starting point for a series <strong>of</strong> steps described below. The necessaryactions fall into six main groups: engagement <strong>of</strong> institutions and enterprises outside thegovernment; public information and outreach (described separately); in-depth conceptualengineering design and financial feasibility studies; technology identification, screening andapplication; establishment <strong>of</strong> financing mechanisms; negotiation <strong>of</strong> prices acceptable to allparties for harvested sugar cane, independent electric power from sugar mills, and biodieselfeedstocks; and project implementation. An illustrative schedule, covering a five-year timeframe, appears at the end <strong>of</strong> this annex.Institutional EngagementThe successful formulation <strong>of</strong> a policy and the November workshop provide an opportunity toexpand the existing <strong>Bi<strong>of</strong>uels</strong> Task Force with broader membership to address implementationchallenges. Added members, beyond those currently represented, should include sugar estateowners, the Sugar Divestment Enterprise, All-Island <strong>Jamaica</strong> Cane Farmers Association,<strong>Jamaica</strong> Cane Products Sales, Ltd., <strong>Ministry</strong> <strong>of</strong> Industry, Development Bank <strong>of</strong> <strong>Jamaica</strong>,Agricultural Support Services Project, Petrojam, Ltd., JB Ethanol, <strong>Jamaica</strong> Manufacturers’Association, <strong>Jamaica</strong> Promotions Corporation, <strong>Jamaica</strong> Public Service Co., and the Office <strong>of</strong>Utility Regulation. The list is not exclusive; others may be important to add as well.In addition to an elected chairperson, such an expanded task force would benefit from a fulltimecoordinator, perhaps assigned from the staff <strong>of</strong> the <strong>Ministry</strong> <strong>of</strong> <strong>Energy</strong> and Mining.Among the roles the group could assume would be to identify needs for any future studies andoversee them, resolve disagreements and conflicts, coordinate members’ independentactivities, and monitor and report progress towards a bi<strong>of</strong>uels industry. It could also conduct apublic information and outreach effort, based on a plan developed separately, including publicmeetings and other means <strong>of</strong> communication with stakeholders.The task force may also benefit from the formation <strong>of</strong> working groups or committees toaddress specific opportunities and challenges. For example, a sugar cane working group mightbe able to advance aspects <strong>of</strong> cane and ethanol production expeditiously without requiringparticipation <strong>of</strong> the rest <strong>of</strong> the members at the same level <strong>of</strong> activity. Another group mightfocus on how to advance the introduction <strong>of</strong> oil crops, looking at the main areas <strong>of</strong> crop107