Jamaica Biofuels Report - Ministry of Energy
Jamaica Biofuels Report - Ministry of Energy
Jamaica Biofuels Report - Ministry of Energy

You also want an ePaper? Increase the reach of your titles
YUMPU automatically turns print PDFs into web optimized ePapers that Google loves.
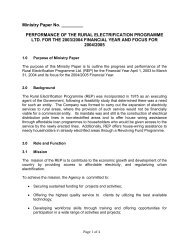
Financial Simulation for Power and Sugar at the Frome EstateInitial Investment $ 94,833,372YEAR0 1 2 3 4 5 6 7 8 9 10 11 12 13 14 15Product valueRefined Sugar (per tonne) $ 550 $ 550 $ 578 $ 606 $ 637 $ 669 $ 702 $ 737 $ 774 $ 813 $ 853 $ 896 $ 941 $ 988 $ 1,037 $1,089Molasses (per tonne) $ 60 $ 60 $ 63 $ 66 $ 69 $ 73 $ 77 $ 80 $ 84 $ 89 $ 93 $ 98 $ 103 $ 108 $ 113 $119Exported electricity (per MWh) $ 100 $ 100 $ 105 $ 110 $ 116 $ 122 $ 128 $ 134 $ 141 $ 148 $ 155 $ 163 $ 171 $ 180 $ 189 $198Product RevenueRefined Sugar $ 35,750,000 $ 37,537,500 $ 39,414,375 $ 41,385,094 $ 43,454,348 $ 45,627,066 $ 47,908,419 $ 50,303,840 $ 52,819,032 $ 55,459,984 $ 58,232,983 $ 61,144,632 $ 64,201,864 $ 67,411,957 $ 70,782,555Molasses $ 1,940,460 $ 2,037,483 $ 2,139,357 $ 2,246,325 $ 2,358,641 $ 2,476,573 $ 2,600,402 $ 2,730,422 $ 2,866,943 $ 3,010,290 $ 3,160,805 $ 3,318,845 $ 3,484,787 $ 3,659,027 $ 3,841,978Exported electricity $ 14,235,000 $ 14,946,750 $ 15,694,088 $ 16,478,792 $ 17,302,731 $ 18,167,868 $ 19,076,261 $ 20,030,075 $ 21,031,578 $ 22,083,157 $ 23,187,315 $ 24,346,681 $ 25,564,015 $ 26,842,216 $ 28,184,326Total Revenue $ 51,925,460 $ 54,521,733 $ 57,247,820 $ 60,110,211 $ 63,115,721 $ 66,271,507 $ 69,585,083 $ 73,064,337 $ 76,717,554 $ 80,553,431 $ 84,581,103 $ 88,810,158 $ 93,250,666 $ 97,913,199 $ 102,808,859O&M Costs $ 44,830,819 $ 46,175,744 $ 47,561,016 $ 48,987,847 $ 50,457,482 $ 51,971,206 $ 53,530,343 $ 55,136,253 $ 56,790,341 $ 58,494,051 $ 60,248,872 $ 62,056,338 $ 63,918,029 $ 65,835,569 $ 67,810,637Depreciation (20 years) $ 6,322,225 $ 6,322,225 $ 6,322,225 $ 6,322,225 $ 6,322,225 $ 6,322,225 $ 6,322,225 $ 6,322,225 $ 6,322,225 $ 6,322,225 $ 6,322,225 $ 6,322,225 $ 6,322,225 $ 6,322,225 $ 6,322,225Net Income $ 772,416 $ 2,023,764 $ 3,364,579 $ 4,800,139 $ 6,336,014 $ 7,978,076 $ 9,732,515 $ 11,605,859 $ 13,604,988 $ 15,737,156 $ 18,010,006 $ 20,431,595 $ 23,010,412 $ 25,755,405 $ 28,675,998Taxes 20% 154,483$ 404,753$ 672,916$ 960,028$ 1,267,203$ 1,595,615$ 1,946,503$ 2,321,172$ 2,720,998$ 3,147,431$ 3,602,001$ 4,086,319$ 4,602,082$ 5,151,081 $$ 5,735,200Income after tax $ 617,933 $ 1,619,011 $ 2,691,663 $ 3,840,111 $ 5,068,811 $ 6,382,461 $ 7,786,012 $ 9,284,687 $ 10,883,991 $ 12,589,725 $ 14,408,005 $ 16,345,276 $ 18,408,330 $ 20,604,324 $ 22,940,798(add back depreciation) $ 6,322,225 $ 6,322,225 $ 6,322,225 $ 6,322,225 $ 6,322,225 $ 6,322,225 $ 6,322,225 $ 6,322,225 $ 6,322,225 $ 6,322,225 $ 6,322,225 $ 6,322,225 $ 6,322,225 $ 6,322,225 $ 6,322,225Cash Flow $ 6,940,158 $ 7,941,236 $ 9,013,888 $ 10,162,336 $ 11,391,036 $ 12,704,686 $ 14,108,237 $ 15,606,912 $ 17,206,215 $ 18,911,949 $ 20,730,229 $ 22,667,501 $ 24,730,555 $ 26,926,549 $ 29,263,023Discounted cash flow $ 6,224,357 $ 6,387,610 $ 6,502,608 $ 6,574,975 $ 6,609,809 $ 6,611,724 $ 6,584,892 $ 6,533,081 $ 6,459,688 $ 6,367,774 $ 6,260,090 $ 6,139,107 $ 6,007,041 $ 5,865,872 $ 5,717,368Cumulative discounted cash flow $ (94,833,372) $ (88,609,016) $ (82,221,406) $ (75,718,798) $ (69,143,824) $ (62,534,015) $ (55,922,291) $ (49,337,399) $ (42,804,318) $ (36,344,629) $ (29,976,856) $ (23,716,766) $ (17,577,659) $ (11,570,618) $ (5,704,746) $12,622Annual Escallation Rate (products) 5%Annual Escallation Rate (supplies) 3%Annual Discount Rate 11.50%90