Jamaica Biofuels Report - Ministry of Energy
Jamaica Biofuels Report - Ministry of Energy
Jamaica Biofuels Report - Ministry of Energy

You also want an ePaper? Increase the reach of your titles
YUMPU automatically turns print PDFs into web optimized ePapers that Google loves.
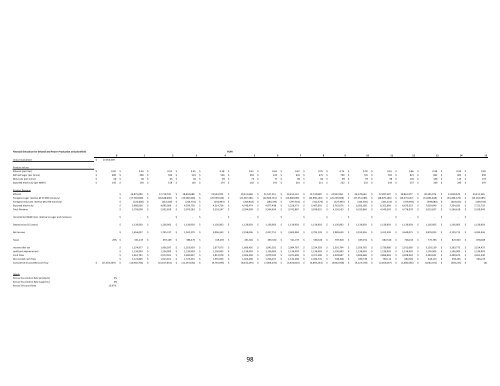
Financial Simulation for Ethanol and Power Production at DuckenfieldInitial Investment $ 17,053,549YEAR0 1 2 3 4 5 6 7 8 9 10 11 12 13 14 15Product valuesEthanol (per liter) $ 0.50 $ 0.50 $ 0.53 $ 0.55 $ 0.58 $ 0.61 $ 0.64 $ 0.67 $ 0.70 $ 0.74 $ 0.78 $ 0.81 $ 0.86 $ 0.90 $ 0.94 $0.99Refined Sugar (per tonne) $ 480 $ 480 $ 504 $ 529 $ 556 $ 583 $ 613 $ 643 $ 675 $ 709 $ 745 $ 782 $ 821 $ 862 $ 905 $950Molasses (per tonne) $ 60 $ 60 $ 63 $ 66 $ 69 $ 73 $ 77 $ 80 $ 84 $ 89 $ 93 $ 98 $ 103 $ 108 $ 113 $119Exported electricity (per MWh) $ 150 $ 150 $ 158 $ 165 $ 174 $ 182 $ 191 $ 201 $ 211 $ 222 $ 233 $ 244 $ 257 $ 269 $ 283 $297Product RevenueEthanol $ 16,875,000 $ 17,718,750 $ 18,604,688 $ 19,534,922 $ 20,511,668 $ 21,537,251 $ 22,614,114 $ 23,744,820 $ 24,932,061 $ 26,178,664 $ 27,487,597 $ 28,861,977 $ 30,305,076 $ 31,820,329 $ 33,411,346Foregone sugar revenue @ 37,000 tonnes/yr $ (17,760,000) $ (18,648,000) $ (19,580,400) $ (20,559,420) $ (21,587,391) $ (22,666,761) $ (23,800,099) $ (24,990,104) $ (26,239,609) $ (27,551,589) $ (28,929,169) $ (30,375,627) $ (31,894,408) $ (33,489,129) $ (35,163,585)Foregone molasses revenue @3,700 tonnes/yr $ (222,000) $ (233,100) $ (244,755) $ (256,993) $ (269,842) $ (283,335) $ (297,501) $ (312,376) $ (327,995) $ (344,395) $ (361,615) $ (379,695) $ (398,680) $ (418,614) $ (439,545)Exported electricity $ 3,900,000 $ 4,095,000 $ 4,299,750 $ 4,514,738 $ 4,740,474 $ 4,977,498 $ 5,226,373 $ 5,487,692 $ 5,762,076 $ 6,050,180 $ 6,352,689 $ 6,670,323 $ 7,003,840 $ 7,354,032 $ 7,721,733Total Revenue $ 2,793,000 $ 2,932,650 $ 3,079,283 $ 3,233,247 $ 3,394,909 $ 3,564,654 $ 3,742,887 $ 3,930,031 $ 4,126,533 $ 4,332,860 $ 4,549,503 $ 4,776,978 $ 5,015,827 $ 5,266,618 $ 5,529,949Incremental O&M Costs relative to sugar and molasses $ - $ - $ - $ - $ - $ - $ - $ - $ - $ - $ - $ - $ - $ - $-Depreciation (15 years) $ 1,136,903 $ 1,136,903 $ 1,136,903 $ 1,136,903 $ 1,136,903 $ 1,136,903 $ 1,136,903 $ 1,136,903 $ 1,136,903 $ 1,136,903 $ 1,136,903 $ 1,136,903 $ 1,136,903 $ 1,136,903 $ 1,136,903Net Income $ 1,656,097 $ 1,795,747 $ 1,942,379 $ 2,096,343 $ 2,258,006 $ 2,427,751 $ 2,605,984 $ 2,793,128 $ 2,989,630 $ 3,195,956 $ 3,412,599 $ 3,640,075 $ 3,878,923 $ 4,129,715 $ 4,393,046Taxes 20% $ 331,219 $ 359,149 $ 388,476 $ 419,269 $ 451,601 $ 485,550 $ 521,197 $ 558,626 $ 597,926 $ 639,191 $ 682,520 $ 728,015 $ 775,785 $ 825,943 $ 878,609Income after tax $ 1,324,877 $ 1,436,597 $ 1,553,903 $ 1,677,075 $ 1,806,405 $ 1,942,201 $ 2,084,787 $ 2,234,503 $ 2,391,704 $ 2,556,765 $ 2,730,080 $ 2,912,060 $ 3,103,139 $ 3,303,772 $ 3,514,437(add back depreciation) $ 1,136,903 $ 1,136,903 $ 1,136,903 $ 1,136,903 $ 1,136,903 $ 1,136,903 $ 1,136,903 $ 1,136,903 $ 1,136,903 $ 1,136,903 $ 1,136,903 $ 1,136,903 $ 1,136,903 $ 1,136,903 $ 1,136,903Cash Flow $ 2,461,781 $ 2,573,501 $ 2,690,807 $ 2,813,978 $ 2,943,308 $ 3,079,104 $ 3,221,690 $ 3,371,406 $ 3,528,607 $ 3,693,668 $ 3,866,983 $ 4,048,963 $ 4,240,042 $ 4,440,675 $ 4,651,340Discounted cash flow $ 2,122,846 $ 1,913,651 $ 1,725,401 $ 1,555,956 $ 1,403,400 $ 1,266,017 $ 1,142,268 $ 1,030,776 $ 930,306 $ 839,749 $ 758,112 $ 684,501 $ 618,115 $ 558,236 $ 504,215Cumulative discounted cash flow $ (17,053,549) $ (14,930,703) $ (13,017,053) $ (11,291,652) $ (9,735,695) $ (8,332,295) $ (7,066,278) $ (5,924,010) $ (4,893,234) $ (3,962,928) $ (3,123,178) $ (2,365,067) $ (1,680,566) $ (1,062,451) $ (504,215) $(0)InputsAnnual Escallation Rate (products) 5%Annual Escallation Rate (supplies) 3%Annual Discount Rate 15.97%30.00%25.00%20.00%15.00%10.00%5.00%0.00%$400 $425 $450 $475 $500 $525 $55098