Proceedings Fonetik 2009 - Institutionen för lingvistik
Proceedings Fonetik 2009 - Institutionen för lingvistik
Proceedings Fonetik 2009 - Institutionen för lingvistik

Create successful ePaper yourself
Turn your PDF publications into a flip-book with our unique Google optimized e-Paper software.
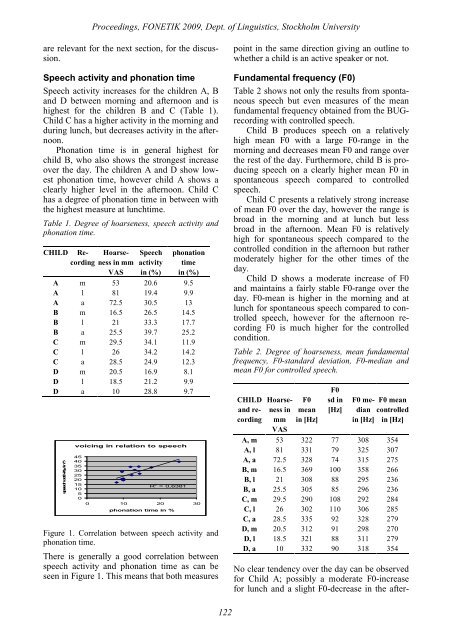
<strong>Proceedings</strong>, FONETIK <strong>2009</strong>, Dept. of Linguistics, Stockholm Universityare relevant for the next section, for the discussion.Speech activity and phonation timeSpeech activity increases for the children A, Band D between morning and afternoon and ishighest for the children B and C (Table 1).Child C has a higher activity in the morning andduring lunch, but decreases activity in the afternoon.Phonation time is in general highest forchild B, who also shows the strongest increaseover the day. The children A and D show lowestphonation time, however child A shows aclearly higher level in the afternoon. Child Chas a degree of phonation time in between withthe highest measure at lunchtime.Table 1. Degree of hoarseness, speech activity andphonation time.CHILDRecordingHoarsenessin mmVASSpeechactivityin (%)phonationtimein (%)A m 53 20.6 9.5A l 81 19.4 9.9A a 72.5 30.5 13B m 16.5 26.5 14.5B l 21 33.3 17.7B a 25.5 39.7 25.2C m 29.5 34.1 11.9C l 26 34.2 14.2C a 28.5 24.9 12.3D m 20.5 16.9 8.1D l 18.5 21.2 9.9D a 10 28.8 9.7speechactivityin%voicing in relation to speech454035302520151050R 2 = 0,63810 10 20 30phonation time in %Figure 1. Correlation between speech activity andphonation time.There is generally a good correlation betweenspeech activity and phonation time as can beseen in Figure 1. This means that both measurespoint in the same direction giving an outline towhether a child is an active speaker or not.Fundamental frequency (F0)Table 2 shows not only the results from spontaneousspeech but even measures of the meanfundamental frequency obtained from the BUGrecordingwith controlled speech.Child B produces speech on a relativelyhigh mean F0 with a large F0-range in themorning and decreases mean F0 and range overthe rest of the day. Furthermore, child B is producingspeech on a clearly higher mean F0 inspontaneous speech compared to controlledspeech.Child C presents a relatively strong increaseof mean F0 over the day, however the range isbroad in the morning and at lunch but lessbroad in the afternoon. Mean F0 is relativelyhigh for spontaneous speech compared to thecontrolled condition in the afternoon but rathermoderately higher for the other times of theday.Child D shows a moderate increase of F0and maintains a fairly stable F0-range over theday. F0-mean is higher in the morning and atlunch for spontaneous speech compared to controlledspeech, however for the afternoon recordingF0 is much higher for the controlledcondition.Table 2. Degree of hoarseness, mean fundamentalfrequency, F0-standard deviation, F0-median andmean F0 for controlled speech.CHILDand recordingHoarsenessinmmVASF0meanin [Hz]F0sd in[Hz]F0 medianin [Hz]F0 meancontrolledin [Hz]A, m 53 322 77 308 354A, l 81 331 79 325 307A, a 72.5 328 74 315 275B, m 16.5 369 100 358 266B, l 21 308 88 295 236B, a 25.5 305 85 296 236C, m 29.5 290 108 292 284C, l 26 302 110 306 285C, a 28.5 335 92 328 279D, m 20.5 312 91 298 270D, l 18.5 321 88 311 279D, a 10 332 90 318 354No clear tendency over the day can be observedfor Child A; possibly a moderate F0-increasefor lunch and a slight F0-decrease in the after-122