Proceedings Fonetik 2009 - Institutionen för lingvistik
Proceedings Fonetik 2009 - Institutionen för lingvistik
Proceedings Fonetik 2009 - Institutionen för lingvistik

Create successful ePaper yourself
Turn your PDF publications into a flip-book with our unique Google optimized e-Paper software.
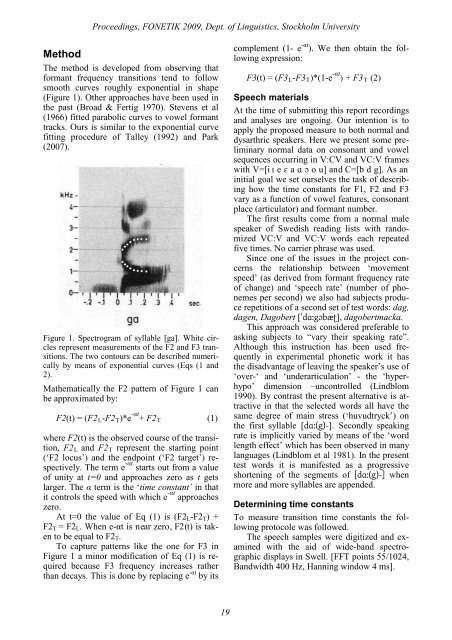
<strong>Proceedings</strong>, FONETIK <strong>2009</strong>, Dept. of Linguistics, Stockholm UniversityMethodThe method is developed from observing thatformant frequency transitions tend to followsmooth curves roughly exponential in shape(Figure 1). Other approaches have been used inthe past (Broad & Fertig 1970). Stevens et al(1966) fitted parabolic curves to vowel formanttracks. Ours is similar to the exponential curvefitting procedure of Talley (1992) and Park(2007).Figure 1. Spectrogram of syllable [ga]. White circlesrepresent measurements of the F2 and F3 transitions.The two contours can be described numericallyby means of exponential curves (Eqs (1 and2).Mathematically the F2 pattern of Figure 1 canbe approximated by:F2(t) = (F2 L -F2 T )*e -αt + F2 T (1)where F2(t) is the observed course of the transition,F2 L and F2 T represent the starting point(‘F2 locus’) and the endpoint (‘F2 target’) respectively.The term e -αt starts out from a valueof unity at t=0 and approaches zero as t getslarger. The α term is the ‘time constant’ in thatit controls the speed with which e -αt approacheszero.At t=0 the value of Eq (1) is (F2 L -F2 T ) +F2 T = F2 L . When e-αt is near zero, F2(t) is takento be equal to F2 T .To capture patterns like the one for F3 inFigure 1 a minor modification of Eq (1) is requiredbecause F3 frequency increases ratherthan decays. This is done by replacing e -αt by itscomplement (1- e -αt ). We then obtain the followingexpression:F3(t) = (F3 L -F3 T )*(1-e -αt ) + F3 T (2)Speech materialsAt the time of submitting this report recordingsand analyses are ongoing. Our intention is toapply the proposed measure to both normal anddysarthric speakers. Here we present some preliminarynormal data on consonant and vowelsequences occurring in V:CV and VC:V frameswith V=[i ɪ e ɛ a ɑ ɔ o u] and C=[b d g]. As aninitial goal we set ourselves the task of describinghow the time constants for F1, F2 and F3vary as a function of vowel features, consonantplace (articulator) and formant number.The first results come from a normal malespeaker of Swedish reading lists with randomizedVC:V and VC:V words each repeatedfive times. No carrier phrase was used.Since one of the issues in the project concernsthe relationship between ‘movementspeed’ (as derived from formant frequency rateof change) and ‘speech rate’ (number of phonemesper second) we also had subjects producerepetitions of a second set of test words: dag,dagen, Dagobert [ˈdɑ:gɔbæʈ], dagobertmacka.This approach was considered preferable toasking subjects to “vary their speaking rate”.Although this instruction has been used frequentlyin experimental phonetic work it hasthe disadvantage of leaving the speaker’s use of‘over-‘ and ‘underarticulation’ - the ‘hyperhypo’dimension –uncontrolled (Lindblom1990). By contrast the present alternative is attractivein that the selected words all have thesame degree of main stress (‘huvudtryck’) onthe first syllable [dɑ:(g)-]. Secondly speakingrate is implicitly varied by means of the ‘wordlength effect’ which has been observed in manylanguages (Lindblom et al 1981). In the presenttest words it is manifested as a progressiveshortening of the segments of [dɑ:(g)-] whenmore and more syllables are appended.Determining time constantsTo measure transition time constants the followingprotocole was followed.The speech samples were digitized and examinedwith the aid of wide-band spectrographicdisplays in Swell. [FFT points 55/1024,Bandwidth 400 Hz, Hanning window 4 ms].19