Proceedings Fonetik 2009 - Institutionen för lingvistik
Proceedings Fonetik 2009 - Institutionen för lingvistik
Proceedings Fonetik 2009 - Institutionen för lingvistik

Create successful ePaper yourself
Turn your PDF publications into a flip-book with our unique Google optimized e-Paper software.
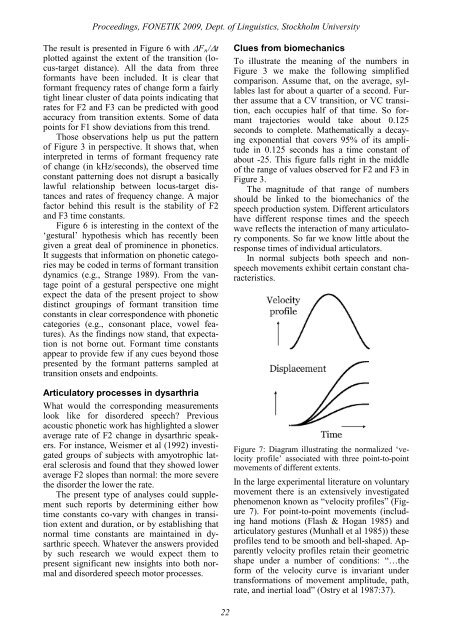
<strong>Proceedings</strong>, FONETIK <strong>2009</strong>, Dept. of Linguistics, Stockholm UniversityThe result is presented in Figure 6 with ∆F n /∆tplotted against the extent of the transition (locus-targetdistance). All the data from threeformants have been included. It is clear thatformant frequency rates of change form a fairlytight linear cluster of data points indicating thatrates for F2 and F3 can be predicted with goodaccuracy from transition extents. Some of datapoints for F1 show deviations from this trend.Those observations help us put the patternof Figure 3 in perspective. It shows that, wheninterpreted in terms of formant frequency rateof change (in kHz/seconds), the observed timeconstant patterning does not disrupt a basicallylawful relationship between locus-target distancesand rates of frequency change. A majorfactor behind this result is the stability of F2and F3 time constants.Figure 6 is interesting in the context of the‘gestural’ hypothesis which has recently beengiven a great deal of prominence in phonetics.It suggests that information on phonetic categoriesmay be coded in terms of formant transitiondynamics (e.g., Strange 1989). From the vantagepoint of a gestural perspective one mightexpect the data of the present project to showdistinct groupings of formant transition timeconstants in clear correspondence with phoneticcategories (e.g., consonant place, vowel features).As the findings now stand, that expectationis not borne out. Formant time constantsappear to provide few if any cues beyond thosepresented by the formant patterns sampled attransition onsets and endpoints.Articulatory processes in dysarthriaWhat would the corresponding measurementslook like for disordered speech? Previousacoustic phonetic work has highlighted a sloweraverage rate of F2 change in dysarthric speakers.For instance, Weismer et al (1992) investigatedgroups of subjects with amyotrophic lateralsclerosis and found that they showed loweraverage F2 slopes than normal: the more severethe disorder the lower the rate.The present type of analyses could supplementsuch reports by determining either howtime constants co-vary with changes in transitionextent and duration, or by establishing thatnormal time constants are maintained in dysarthricspeech. Whatever the answers providedby such research we would expect them topresent significant new insights into both normaland disordered speech motor processes.Clues from biomechanicsTo illustrate the meaning of the numbers inFigure 3 we make the following simplifiedcomparison. Assume that, on the average, syllableslast for about a quarter of a second. Furtherassume that a CV transition, or VC transition,each occupies half of that time. So formanttrajectories would take about 0.125seconds to complete. Mathematically a decayingexponential that covers 95% of its amplitudein 0.125 seconds has a time constant ofabout -25. This figure falls right in the middleof the range of values observed for F2 and F3 inFigure 3.The magnitude of that range of numbersshould be linked to the biomechanics of thespeech production system. Different articulatorshave different response times and the speechwave reflects the interaction of many articulatorycomponents. So far we know little about theresponse times of individual articulators.In normal subjects both speech and nonspeechmovements exhibit certain constant characteristics.Figure 7: Diagram illustrating the normalized ‘velocityprofile’ associated with three point-to-pointmovements of different extents.In the large experimental literature on voluntarymovement there is an extensively investigatedphenomenon known as “velocity profiles” (Figure7). For point-to-point movements (includinghand motions (Flash & Hogan 1985) andarticulatory gestures (Munhall et al 1985)) theseprofiles tend to be smooth and bell-shaped. Apparentlyvelocity profiles retain their geometricshape under a number of conditions: “…theform of the velocity curve is invariant undertransformations of movement amplitude, path,rate, and inertial load” (Ostry et al 1987:37).22