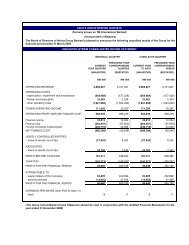
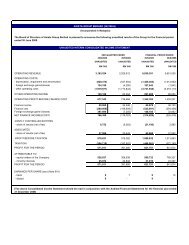
STATEMENTS OFCOMPREHENSIVE INCOMEFOR THE FINANCIAL YEAR ENDED 31 DECEMBER <strong>2012</strong> (CONTINUED)<strong>Group</strong> Companynote <strong>2012</strong> 2011 <strong>2012</strong> 2011RM’000 RM’000 RM’000 RM’000RestatedOther comprehensive expense– net investment hedge, net of tax (40,354) (6,220) – –– actuarial losses, net of tax 46(b) (6,592) – – –– currency translation differences 46(c) (586,456) (118,083) – –Total comprehensive income forthe financial year 2,246,175 2,587,947 2,741,384 62,955Profit for the financial yearattributable to:– owners of the Company 2,513,285 2,345,628 2,741,384 62,955– non–controlling interests 366,292 366,622 – –2,879,577 2,712,250 2,741,384 62,955Total comprehensive income forthe financial year attributable to:– owners of the Company 2,047,141 2,206,151 2,741,384 62,955– non–controlling interests 199,034 381,796 – –2,246,175 2,587,947 2,741,384 62,955Earnings per share (sen)– basic 12(a) 29.6 27.8 – –– diluted 12(b) 29.5 27.6 – –The above Statements of Comprehensive Income are to be read in conjunction with the notes to the financialstatements on pages 175 to 308.168
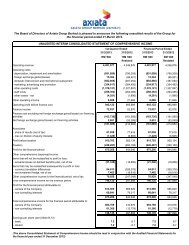
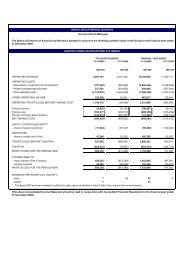
<strong>Axiata</strong> <strong>Group</strong> <strong>Berhad</strong> (242188-H) <strong>Annual</strong> <strong>Report</strong> <strong>2012</strong>STATEMENTS OFFINANCIAL POSITIONAS AT 31 DECEMBER <strong>2012</strong>CAPITAL AND RESERVESATTRIBUTABLE TO OWNERSOF THE COMPANY<strong>Group</strong> Companynote 31.12.<strong>2012</strong> 31.12.2011 1.1.2011 31.12.<strong>2012</strong> 31.12.2011 1.1.2011RM’000 RM’000 RM’000 RM’000 RM’000 RM’000Restated RestatedShare capital 13 8,508,209 8,466,182 8,445,154 8,508,209 8,466,182 8,445,154Share premium 2,094,125 1,989,885 1,972,964 2,094,125 1,989,885 1,972,964Reserves 15 9,498,174 9,387,015 8,307,191 5,512,330 4,711,015 5,780,819Total equity attributable to ownersof the company 20,100,508 19,843,082 18,725,309 16,114,664 15,167,082 16,198,937Non-controlling interests 1,906,714 1,832,415 1,553,339 – – –Total equity 22,007,222 21,675,497 20,278,648 16,114,664 15,167,082 16,198,937NON-CURRENT LIABILITIESBorrowings 16 10,765,691 9,231,424 9,983,983 762,366 773,057 738,758Derivative financial instruments 19 194,181 127,749 191,527 45,249 33,609 66,427Deferred income 20 247,188 136,056 – – – –Other payables 21 68,417 177,946 52,471 – – –Provision for liabilities 22 338,948 343,148 249,433 – – –Deferred tax liabilities 23 1,418,265 1,380,054 1,333,863 – – –Total non-current liabilities 13,032,690 11,396,377 11,811,277 807,615 806,666 805,18535,039,912 33,071,874 32,089,925 16,922,279 15,973,748 17,004,122NON-CURRENT ASSETSIntangible assets 24 8,392,514 8,297,978 7,605,498 – – –Property, plant and equipment 25 16,585,314 16,161,531 15,130,246 11,425 12,274 10,085Investment properties 26 – – 2,020 – – –Subsidiaries 27 – – – 13,629,758 13,489,816 13,463,536Jointly controlled entities 28 1,618 – – – – –Associates 29 6,838,467 6,769,135 6,698,484 124,802 124,802 124,802Available-for-sale financial asset 892 893 888 – – –Derivative financial instruments 19 33,621 44,891 14,964 – – –Long term receivables 30 98,750 108,858 111,313 – – –Amounts due from subsidiaries 32 – – – 85,772 222,612 181,203Deferred tax assets 23 263,842 315,611 117,457 – – –Total non-current assets 32,215,018 31,698,897 29,680,870 13,851,757 13,849,504 13,779,626169
- Page 1:
AXIATA GROUP BERHAD (242188-H) ANNU
- Page 4 and 5:
PakistanBangladeshIndiaThailandCamb
- Page 6 and 7:
CONTENTS006 Financial Calenda
- Page 8 and 9:
FinancialCalendar 2012QUARTERLY RES
- Page 10 and 11:
Raising The BarAxiata is continuous
- Page 12 and 13:
Chairman’sStatementTan Sri Dato
- Page 14 and 15:
Chairman’sStatementHIGH GROWTH MA
- Page 16 and 17:
President& GCEO’SBusinessReviewDA
- Page 18 and 19:
President &GCEO’S Business Review
- Page 20 and 21:
President &GCEO’S Business Review
- Page 22 and 23:
President &GCEO’S Business Review
- Page 24:
President &GCEO’S Business Review
- Page 27 and 28:
Axiata Group Berhad (242188-H) Annu
- Page 29 and 30:
Axiata Group Berhad (242188-H) Annu
- Page 32 and 33:
Five-yeargroup financial summaryOPE
- Page 34:
Awards andRecognitionIndonesia Serv
- Page 37 and 38:
Axiata Group Berhad (242188-H) Annu
- Page 39 and 40:
Axiata Group Berhad (242188-H) Annu
- Page 41 and 42:
Axiata Group Berhad (242188-H) Annu
- Page 43 and 44:
Axiata Group Berhad (242188-H) Annu
- Page 45 and 46:
Axiata Group Berhad (242188-H) Annu
- Page 47 and 48:
Axiata Group Berhad (242188-H) Annu
- Page 49 and 50:
Axiata Group Berhad (242188-H) Annu
- Page 51 and 52:
Axiata Group Berhad (242188-H) Annu
- Page 53 and 54:
Axiata Group Berhad (242188-H) Annu
- Page 55 and 56:
Axiata Group Berhad (242188-H) Annu
- Page 57 and 58:
Axiata Group Berhad (242188-H) Annu
- Page 59 and 60:
Axiata Group Berhad (242188-H) Annu
- Page 61 and 62:
Axiata Group Berhad (242188-H) Annu
- Page 63 and 64:
Axiata Group Berhad (242188-H) Annu
- Page 65 and 66:
Axiata Group Berhad (242188-H) Annu
- Page 67 and 68:
Axiata Group Berhad (242188-H) Annu
- Page 69 and 70:
Axiata Group Berhad (242188-H) Annu
- Page 71 and 72:
Axiata Group Berhad (242188-H) Annu
- Page 73 and 74:
Axiata Group Berhad (242188-H) Annu
- Page 75 and 76:
Axiata Group Berhad (242188-H) Annu
- Page 77 and 78:
Axiata Group Berhad (242188-H) Annu
- Page 79 and 80:
Axiata Group Berhad (242188-H) Annu
- Page 81 and 82:
Axiata Group Berhad (242188-H) Annu
- Page 83 and 84:
Axiata Group Berhad (242188-H) Annu
- Page 85 and 86:
Axiata Group Berhad (242188-H) Annu
- Page 87 and 88:
Axiata Group Berhad (242188-H) Annu
- Page 89 and 90:
Axiata Group Berhad (242188-H) Annu
- Page 91 and 92:
Axiata Group Berhad (242188-H) Annu
- Page 93 and 94:
Axiata Group Berhad (242188-H) Annu
- Page 95 and 96:
Axiata Group Berhad (242188-H) Annu
- Page 97 and 98:
Axiata Group Berhad (242188-H) Annu
- Page 99 and 100:
Axiata Group Berhad (242188-H) Annu
- Page 101 and 102:
Axiata Group Berhad (242188-H) Annu
- Page 103 and 104:
Axiata Group Berhad (242188-H) Annu
- Page 105 and 106:
Axiata Group Berhad (242188-H) Annu
- Page 107 and 108:
Axiata Group Berhad (242188-H) Annu
- Page 109 and 110:
Axiata Group Berhad (242188-H) Annu
- Page 111 and 112:
Axiata Group Berhad (242188-H) Annu
- Page 113 and 114:
Axiata Group Berhad (242188-H) Annu
- Page 115 and 116:
Axiata Group Berhad (242188-H) Annu
- Page 117 and 118:
Axiata Group Berhad (242188-H) Annu
- Page 119 and 120: Axiata Group Berhad (242188-H) Annu
- Page 121 and 122: Axiata Group Berhad (242188-H) Annu
- Page 123 and 124: Axiata Group Berhad (242188-H) Annu
- Page 125 and 126: Axiata Group Berhad (242188-H) Annu
- Page 127 and 128: Axiata Group Berhad (242188-H) Annu
- Page 129 and 130: Axiata Group Berhad (242188-H) Annu
- Page 131 and 132: Axiata Group Berhad (242188-H) Annu
- Page 133 and 134: Axiata Group Berhad (242188-H) Annu
- Page 135 and 136: Axiata Group Berhad (242188-H) Annu
- Page 137 and 138: Axiata Group Berhad (242188-H) Annu
- Page 139 and 140: Axiata Group Berhad (242188-H) Annu
- Page 141 and 142: Axiata Group Berhad (242188-H) Annu
- Page 143 and 144: Axiata Group Berhad (242188-H) Annu
- Page 145 and 146: Axiata Group Berhad (242188-H) Annu
- Page 147 and 148: Axiata Group Berhad (242188-H) Annu
- Page 149 and 150: Axiata Group Berhad (242188-H) Annu
- Page 151 and 152: Axiata Group Berhad (242188-H) Annu
- Page 153 and 154: Axiata Group Berhad (242188-H) Annu
- Page 155 and 156: Axiata Group Berhad (242188-H) Annu
- Page 157 and 158: Axiata Group Berhad (242188-H) Annu
- Page 159 and 160: Axiata Group Berhad (242188-H) Annu
- Page 162 and 163: DIRECTORS’RESPONSIBILITY STATEMEN
- Page 164 and 165: DIRECTORS’REPORTSHARE CAPITALDuri
- Page 166 and 167: DIRECTORS’REPORTDIRECTORS’ INTE
- Page 168 and 169: DIRECTORS’REPORTSTATUTORY INFORMA
- Page 172 and 173: STATEMENTS OFFINANCIAL POSITIONAS A
- Page 174 and 175: CONSOLIDATED STATEMENT OFCHANGES IN
- Page 176 and 177: STATEMENTS OFCASH FLOWSFOR THE FINA
- Page 178 and 179: NOTES TO THEFINANCIAL STATEMENTSFOR
- Page 180 and 181: NOTES TO THEFINANCIAL STATEMENTSFOR
- Page 182 and 183: NOTES TO THEFINANCIAL STATEMENTSFOR
- Page 184 and 185: NOTES TO THEFINANCIAL STATEMENTSFOR
- Page 186 and 187: NOTES TO THEFINANCIAL STATEMENTSFOR
- Page 188 and 189: NOTES TO THEFINANCIAL STATEMENTSFOR
- Page 190 and 191: NOTES TO THEFINANCIAL STATEMENTSFOR
- Page 192 and 193: NOTES TO THEFINANCIAL STATEMENTSFOR
- Page 194 and 195: NOTES TO THEFINANCIAL STATEMENTSFOR
- Page 196 and 197: NOTES TO THEFINANCIAL STATEMENTSFOR
- Page 198 and 199: NOTES TO THEFINANCIAL STATEMENTSFOR
- Page 200 and 201: NOTES TO THEFINANCIAL STATEMENTSFOR
- Page 202 and 203: NOTES TO THEFINANCIAL STATEMENTSFOR
- Page 204 and 205: NOTES TO THEFINANCIAL STATEMENTSFOR
- Page 206 and 207: NOTES TO THEFINANCIAL STATEMENTSFOR
- Page 208 and 209: NOTES TO THEFINANCIAL STATEMENTSFOR
- Page 210 and 211: NOTES TO THEFINANCIAL STATEMENTSFOR
- Page 212 and 213: NOTES TO THEFINANCIAL STATEMENTSFOR
- Page 214 and 215: NOTES TO THEFINANCIAL STATEMENTSFOR
- Page 216 and 217: NOTES TO THEFINANCIAL STATEMENTSFOR
- Page 218 and 219: NOTES TO THEFINANCIAL STATEMENTSFOR
- Page 220 and 221:
NOTES TO THEFINANCIAL STATEMENTSFOR
- Page 222 and 223:
NOTES TO THEFINANCIAL STATEMENTSFOR
- Page 224 and 225:
NOTES TO THEFINANCIAL STATEMENTSFOR
- Page 226 and 227:
NOTES TO THEFINANCIAL STATEMENTSFOR
- Page 228 and 229:
NOTES TO THEFINANCIAL STATEMENTSFOR
- Page 230 and 231:
NOTES TO THEFINANCIAL STATEMENTSFOR
- Page 232 and 233:
NOTES TO THEFINANCIAL STATEMENTSFOR
- Page 234 and 235:
NOTES TO THEFINANCIAL STATEMENTSFOR
- Page 236 and 237:
NOTES TO THEFINANCIAL STATEMENTSFOR
- Page 238 and 239:
NOTES TO THEFINANCIAL STATEMENTSFOR
- Page 240 and 241:
NOTES TO THEFINANCIAL STATEMENTSFOR
- Page 242 and 243:
NOTES TO THEFINANCIAL STATEMENTSFOR
- Page 244 and 245:
NOTES TO THEFINANCIAL STATEMENTSFOR
- Page 246 and 247:
NOTES TO THEFINANCIAL STATEMENTSFOR
- Page 248 and 249:
NOTES TO THEFINANCIAL STATEMENTSFOR
- Page 250 and 251:
NOTES TO THEFINANCIAL STATEMENTSFOR
- Page 252 and 253:
NOTES TO THEFINANCIAL STATEMENTSFOR
- Page 254 and 255:
NOTES TO THEFINANCIAL STATEMENTSFOR
- Page 256 and 257:
NOTES TO THEFINANCIAL STATEMENTSFOR
- Page 258 and 259:
NOTES TO THEFINANCIAL STATEMENTSFOR
- Page 260 and 261:
NOTES TO THEFINANCIAL STATEMENTSFOR
- Page 262 and 263:
NOTES TO THEFINANCIAL STATEMENTSFOR
- Page 264 and 265:
NOTES TO THEFINANCIAL STATEMENTSFOR
- Page 266 and 267:
NOTES TO THEFINANCIAL STATEMENTSFOR
- Page 268 and 269:
NOTES TO THEFINANCIAL STATEMENTSFOR
- Page 270 and 271:
NOTES TO THEFINANCIAL STATEMENTSFOR
- Page 272 and 273:
NOTES TO THEFINANCIAL STATEMENTSFOR
- Page 274 and 275:
NOTES TO THEFINANCIAL STATEMENTSFOR
- Page 276 and 277:
NOTES TO THEFINANCIAL STATEMENTSFOR
- Page 278 and 279:
NOTES TO THEFINANCIAL STATEMENTSFOR
- Page 280 and 281:
NOTES TO THEFINANCIAL STATEMENTSFOR
- Page 282 and 283:
NOTES TO THEFINANCIAL STATEMENTSFOR
- Page 284 and 285:
NOTES TO THEFINANCIAL STATEMENTSFOR
- Page 286 and 287:
NOTES TO THEFINANCIAL STATEMENTSFOR
- Page 288 and 289:
NOTES TO THEFINANCIAL STATEMENTSFOR
- Page 290 and 291:
NOTES TO THEFINANCIAL STATEMENTSFOR
- Page 292 and 293:
NOTES TO THEFINANCIAL STATEMENTSFOR
- Page 294 and 295:
NOTES TO THEFINANCIAL STATEMENTSFOR
- Page 296 and 297:
NOTES TO THEFINANCIAL STATEMENTSFOR
- Page 298 and 299:
NOTES TO THEFINANCIAL STATEMENTSFOR
- Page 300 and 301:
NOTES TO THEFINANCIAL STATEMENTSFOR
- Page 302 and 303:
NOTES TO THEFINANCIAL STATEMENTSFOR
- Page 304 and 305:
NOTES TO THEFINANCIAL STATEMENTSFOR
- Page 306 and 307:
NOTES TO THEFINANCIAL STATEMENTSFOR
- Page 308 and 309:
NOTES TO THEFINANCIAL STATEMENTSFOR
- Page 310 and 311:
NOTES TO THEFINANCIAL STATEMENTSFOR
- Page 312 and 313:
STATEMENTBY DIRECTORSPURSUANT TO SE
- Page 314 and 315:
INDEPENDENTAUDITORS’ REPORTTO THE
- Page 316 and 317:
GroupFinancial Analysiscatering for
- Page 318 and 319:
SHAREHOLDINGSTATISTICSAS AT 29 MARC
- Page 320 and 321:
SHAREHOLDINGSTATISTICSAS AT 29 MARC
- Page 322 and 323:
ADDITIONAL COMPLIANCEINFORMATION3.
- Page 324 and 325:
Net Book Value ofLand & BuildingsFo
- Page 326 and 327:
GROUPDIRECTORYAxiata Group BerhadAx
- Page 328 and 329:
GLOSSARYShare Scheme CommitteeEmplo
- Page 330 and 331:
NOTICE OFANNUAL GENERAL MEETINGNOTI
- Page 332 and 333:
NOTICE OFANNUAL GENERAL MEETING10.
- Page 334 and 335:
EXPLANATORY NOTES TO THE SPECIAL BU
- Page 336 and 337:
ADMINISTRATIVE DETAILS FOR THE21ST
- Page 338 and 339:
2. FOLD THIS FLAP TO SEALAFFIX STAM