- Page 1:
AXIATA GROUP BERHAD (242188-H) ANNU
- Page 4 and 5:
PakistanBangladeshIndiaThailandCamb
- Page 6 and 7:
CONTENTS006 Financial Calenda
- Page 8 and 9:
FinancialCalendar 2012QUARTERLY RES
- Page 10 and 11:
Raising The BarAxiata is continuous
- Page 12 and 13:
Chairman’sStatementTan Sri Dato
- Page 14 and 15:
Chairman’sStatementHIGH GROWTH MA
- Page 16 and 17:
President& GCEO’SBusinessReviewDA
- Page 18 and 19:
President &GCEO’S Business Review
- Page 20 and 21:
President &GCEO’S Business Review
- Page 22 and 23:
President &GCEO’S Business Review
- Page 24:
President &GCEO’S Business Review
- Page 27 and 28:
Axiata Group Berhad (242188-H) Annu
- Page 29 and 30:
Axiata Group Berhad (242188-H) Annu
- Page 32 and 33:
Five-yeargroup financial summaryOPE
- Page 34:
Awards andRecognitionIndonesia Serv
- Page 37 and 38:
Axiata Group Berhad (242188-H) Annu
- Page 39 and 40:
Axiata Group Berhad (242188-H) Annu
- Page 41 and 42:
Axiata Group Berhad (242188-H) Annu
- Page 43 and 44:
Axiata Group Berhad (242188-H) Annu
- Page 45 and 46:
Axiata Group Berhad (242188-H) Annu
- Page 47 and 48:
Axiata Group Berhad (242188-H) Annu
- Page 49 and 50:
Axiata Group Berhad (242188-H) Annu
- Page 51 and 52:
Axiata Group Berhad (242188-H) Annu
- Page 53 and 54:
Axiata Group Berhad (242188-H) Annu
- Page 55 and 56:
Axiata Group Berhad (242188-H) Annu
- Page 57 and 58:
Axiata Group Berhad (242188-H) Annu
- Page 59 and 60:
Axiata Group Berhad (242188-H) Annu
- Page 61 and 62:
Axiata Group Berhad (242188-H) Annu
- Page 63 and 64:
Axiata Group Berhad (242188-H) Annu
- Page 65 and 66:
Axiata Group Berhad (242188-H) Annu
- Page 67 and 68:
Axiata Group Berhad (242188-H) Annu
- Page 69 and 70:
Axiata Group Berhad (242188-H) Annu
- Page 71 and 72:
Axiata Group Berhad (242188-H) Annu
- Page 73 and 74:
Axiata Group Berhad (242188-H) Annu
- Page 75 and 76:
Axiata Group Berhad (242188-H) Annu
- Page 77 and 78:
Axiata Group Berhad (242188-H) Annu
- Page 79 and 80:
Axiata Group Berhad (242188-H) Annu
- Page 81 and 82:
Axiata Group Berhad (242188-H) Annu
- Page 83 and 84:
Axiata Group Berhad (242188-H) Annu
- Page 85 and 86:
Axiata Group Berhad (242188-H) Annu
- Page 87 and 88:
Axiata Group Berhad (242188-H) Annu
- Page 89 and 90:
Axiata Group Berhad (242188-H) Annu
- Page 91 and 92:
Axiata Group Berhad (242188-H) Annu
- Page 93 and 94:
Axiata Group Berhad (242188-H) Annu
- Page 95 and 96:
Axiata Group Berhad (242188-H) Annu
- Page 97 and 98:
Axiata Group Berhad (242188-H) Annu
- Page 99 and 100:
Axiata Group Berhad (242188-H) Annu
- Page 101 and 102:
Axiata Group Berhad (242188-H) Annu
- Page 103 and 104:
Axiata Group Berhad (242188-H) Annu
- Page 105 and 106:
Axiata Group Berhad (242188-H) Annu
- Page 107 and 108:
Axiata Group Berhad (242188-H) Annu
- Page 109 and 110:
Axiata Group Berhad (242188-H) Annu
- Page 111 and 112:
Axiata Group Berhad (242188-H) Annu
- Page 113 and 114:
Axiata Group Berhad (242188-H) Annu
- Page 115 and 116:
Axiata Group Berhad (242188-H) Annu
- Page 117 and 118:
Axiata Group Berhad (242188-H) Annu
- Page 119 and 120:
Axiata Group Berhad (242188-H) Annu
- Page 121 and 122:
Axiata Group Berhad (242188-H) Annu
- Page 123 and 124:
Axiata Group Berhad (242188-H) Annu
- Page 125 and 126:
Axiata Group Berhad (242188-H) Annu
- Page 127 and 128:
Axiata Group Berhad (242188-H) Annu
- Page 129 and 130:
Axiata Group Berhad (242188-H) Annu
- Page 131 and 132:
Axiata Group Berhad (242188-H) Annu
- Page 133 and 134:
Axiata Group Berhad (242188-H) Annu
- Page 135 and 136:
Axiata Group Berhad (242188-H) Annu
- Page 137 and 138:
Axiata Group Berhad (242188-H) Annu
- Page 139 and 140:
Axiata Group Berhad (242188-H) Annu
- Page 141 and 142:
Axiata Group Berhad (242188-H) Annu
- Page 143 and 144:
Axiata Group Berhad (242188-H) Annu
- Page 145 and 146:
Axiata Group Berhad (242188-H) Annu
- Page 147 and 148:
Axiata Group Berhad (242188-H) Annu
- Page 149 and 150:
Axiata Group Berhad (242188-H) Annu
- Page 151 and 152:
Axiata Group Berhad (242188-H) Annu
- Page 153 and 154:
Axiata Group Berhad (242188-H) Annu
- Page 155 and 156:
Axiata Group Berhad (242188-H) Annu
- Page 157 and 158:
Axiata Group Berhad (242188-H) Annu
- Page 159 and 160:
Axiata Group Berhad (242188-H) Annu
- Page 162 and 163:
DIRECTORS’RESPONSIBILITY STATEMEN
- Page 164 and 165:
DIRECTORS’REPORTSHARE CAPITALDuri
- Page 166 and 167:
DIRECTORS’REPORTDIRECTORS’ INTE
- Page 168 and 169:
DIRECTORS’REPORTSTATUTORY INFORMA
- Page 170 and 171:
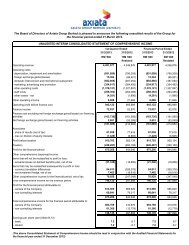
STATEMENTS OFCOMPREHENSIVE INCOMEFO
- Page 172 and 173:
STATEMENTS OFFINANCIAL POSITIONAS A
- Page 174 and 175:
CONSOLIDATED STATEMENT OFCHANGES IN
- Page 176 and 177:
STATEMENTS OFCASH FLOWSFOR THE FINA
- Page 178 and 179:
NOTES TO THEFINANCIAL STATEMENTSFOR
- Page 180 and 181:
NOTES TO THEFINANCIAL STATEMENTSFOR
- Page 182 and 183:
NOTES TO THEFINANCIAL STATEMENTSFOR
- Page 184 and 185:
NOTES TO THEFINANCIAL STATEMENTSFOR
- Page 186 and 187:
NOTES TO THEFINANCIAL STATEMENTSFOR
- Page 188 and 189:
NOTES TO THEFINANCIAL STATEMENTSFOR
- Page 190 and 191:
NOTES TO THEFINANCIAL STATEMENTSFOR
- Page 192 and 193:
NOTES TO THEFINANCIAL STATEMENTSFOR
- Page 194 and 195:
NOTES TO THEFINANCIAL STATEMENTSFOR
- Page 196 and 197:
NOTES TO THEFINANCIAL STATEMENTSFOR
- Page 198 and 199:
NOTES TO THEFINANCIAL STATEMENTSFOR
- Page 200 and 201:
NOTES TO THEFINANCIAL STATEMENTSFOR
- Page 202 and 203:
NOTES TO THEFINANCIAL STATEMENTSFOR
- Page 204 and 205:
NOTES TO THEFINANCIAL STATEMENTSFOR
- Page 206 and 207:
NOTES TO THEFINANCIAL STATEMENTSFOR
- Page 208 and 209:
NOTES TO THEFINANCIAL STATEMENTSFOR
- Page 210 and 211:
NOTES TO THEFINANCIAL STATEMENTSFOR
- Page 212 and 213:
NOTES TO THEFINANCIAL STATEMENTSFOR
- Page 214 and 215:
NOTES TO THEFINANCIAL STATEMENTSFOR
- Page 216 and 217:
NOTES TO THEFINANCIAL STATEMENTSFOR
- Page 218 and 219: NOTES TO THEFINANCIAL STATEMENTSFOR
- Page 220 and 221: NOTES TO THEFINANCIAL STATEMENTSFOR
- Page 222 and 223: NOTES TO THEFINANCIAL STATEMENTSFOR
- Page 224 and 225: NOTES TO THEFINANCIAL STATEMENTSFOR
- Page 226 and 227: NOTES TO THEFINANCIAL STATEMENTSFOR
- Page 228 and 229: NOTES TO THEFINANCIAL STATEMENTSFOR
- Page 230 and 231: NOTES TO THEFINANCIAL STATEMENTSFOR
- Page 232 and 233: NOTES TO THEFINANCIAL STATEMENTSFOR
- Page 234 and 235: NOTES TO THEFINANCIAL STATEMENTSFOR
- Page 236 and 237: NOTES TO THEFINANCIAL STATEMENTSFOR
- Page 238 and 239: NOTES TO THEFINANCIAL STATEMENTSFOR
- Page 240 and 241: NOTES TO THEFINANCIAL STATEMENTSFOR
- Page 242 and 243: NOTES TO THEFINANCIAL STATEMENTSFOR
- Page 244 and 245: NOTES TO THEFINANCIAL STATEMENTSFOR
- Page 246 and 247: NOTES TO THEFINANCIAL STATEMENTSFOR
- Page 248 and 249: NOTES TO THEFINANCIAL STATEMENTSFOR
- Page 250 and 251: NOTES TO THEFINANCIAL STATEMENTSFOR
- Page 252 and 253: NOTES TO THEFINANCIAL STATEMENTSFOR
- Page 254 and 255: NOTES TO THEFINANCIAL STATEMENTSFOR
- Page 256 and 257: NOTES TO THEFINANCIAL STATEMENTSFOR
- Page 258 and 259: NOTES TO THEFINANCIAL STATEMENTSFOR
- Page 260 and 261: NOTES TO THEFINANCIAL STATEMENTSFOR
- Page 262 and 263: NOTES TO THEFINANCIAL STATEMENTSFOR
- Page 264 and 265: NOTES TO THEFINANCIAL STATEMENTSFOR
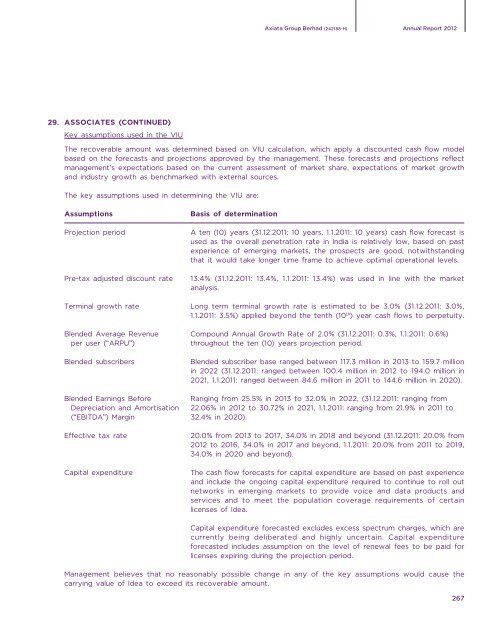
- Page 266 and 267: NOTES TO THEFINANCIAL STATEMENTSFOR
- Page 270 and 271: NOTES TO THEFINANCIAL STATEMENTSFOR
- Page 272 and 273: NOTES TO THEFINANCIAL STATEMENTSFOR
- Page 274 and 275: NOTES TO THEFINANCIAL STATEMENTSFOR
- Page 276 and 277: NOTES TO THEFINANCIAL STATEMENTSFOR
- Page 278 and 279: NOTES TO THEFINANCIAL STATEMENTSFOR
- Page 280 and 281: NOTES TO THEFINANCIAL STATEMENTSFOR
- Page 282 and 283: NOTES TO THEFINANCIAL STATEMENTSFOR
- Page 284 and 285: NOTES TO THEFINANCIAL STATEMENTSFOR
- Page 286 and 287: NOTES TO THEFINANCIAL STATEMENTSFOR
- Page 288 and 289: NOTES TO THEFINANCIAL STATEMENTSFOR
- Page 290 and 291: NOTES TO THEFINANCIAL STATEMENTSFOR
- Page 292 and 293: NOTES TO THEFINANCIAL STATEMENTSFOR
- Page 294 and 295: NOTES TO THEFINANCIAL STATEMENTSFOR
- Page 296 and 297: NOTES TO THEFINANCIAL STATEMENTSFOR
- Page 298 and 299: NOTES TO THEFINANCIAL STATEMENTSFOR
- Page 300 and 301: NOTES TO THEFINANCIAL STATEMENTSFOR
- Page 302 and 303: NOTES TO THEFINANCIAL STATEMENTSFOR
- Page 304 and 305: NOTES TO THEFINANCIAL STATEMENTSFOR
- Page 306 and 307: NOTES TO THEFINANCIAL STATEMENTSFOR
- Page 308 and 309: NOTES TO THEFINANCIAL STATEMENTSFOR
- Page 310 and 311: NOTES TO THEFINANCIAL STATEMENTSFOR
- Page 312 and 313: STATEMENTBY DIRECTORSPURSUANT TO SE
- Page 314 and 315: INDEPENDENTAUDITORS’ REPORTTO THE
- Page 316 and 317: GroupFinancial Analysiscatering for
- Page 318 and 319:
SHAREHOLDINGSTATISTICSAS AT 29 MARC
- Page 320 and 321:
SHAREHOLDINGSTATISTICSAS AT 29 MARC
- Page 322 and 323:
ADDITIONAL COMPLIANCEINFORMATION3.
- Page 324 and 325:
Net Book Value ofLand & BuildingsFo
- Page 326 and 327:
GROUPDIRECTORYAxiata Group BerhadAx
- Page 328 and 329:
GLOSSARYShare Scheme CommitteeEmplo
- Page 330 and 331:
NOTICE OFANNUAL GENERAL MEETINGNOTI
- Page 332 and 333:
NOTICE OFANNUAL GENERAL MEETING10.
- Page 334 and 335:
EXPLANATORY NOTES TO THE SPECIAL BU
- Page 336 and 337:
ADMINISTRATIVE DETAILS FOR THE21ST
- Page 338 and 339:
2. FOLD THIS FLAP TO SEALAFFIX STAM