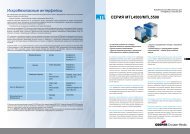
Mobrey
Mobrey
Mobrey

Create successful ePaper yourself
Turn your PDF publications into a flip-book with our unique Google optimized e-Paper software.
Under stable operating conditions, the objective is to record the MSM400 attenuation figure, and immediately take asample of the slurry present between the sensor faces.This is then analysed in the lab, to derive the solids %, andthis % value is later linked to the previous ultrasonic attenuation. The objective is to take three separate readings andsamples, which are averaged by the Microprocessor.Preferably the readings should be taken for a slurry concentration that Is as high as possible, to give the bestaccuracy for the slope calculation. The three readings are date coded, and can all be separately inspected.Ensure that the frequency is correct and that access is enabled as above. With the sensor in a stable representativeslurry, note the value of the relevant “Span dB” which is the attenuation due to the suspended solids. This is thetotal attenuation minus the zero ref and is available in two parameters, Span dB @ A MHz (D854) for 1MHzsensor and Span dB @ BMH2 (D855) for 3.3MHz sensors. They are located in Monitor \ Diagnostics \ Sensor.At the same time take a physical sample of the slurry for laboratory analysis by drying and weighing.Now enter the value of “Span dB” recorded, in the relevant “Span I @ 1MHz” (P130) or “Span I @ 3MHz”(P131) parameters. (accessed via Calibration / Manual Entry / Span)When the laboratory analysis results are available, the span calibration can be completed by entering the solidscontent (in % Solids) into “Lab Value 1” (P150). -(If required, an estimated value can be used until the laboratory analysis results are available.)For improved accuracy up to three samples can be taken. These should be taken at roughly the same time and the“Span dB” noted for each one. The values are entered into the relevant Span 1, Span 2, Span 3 and Lab Value 1,Lab Value 2, and Lab Value 3 (accessed via Calibration / Manual / Entry / Lab Values). The MSM400 willautomatically average as many values as are entered.The MSM400 stores the calculated value of the slope in 0858 (1MHz) and D859 (3.3MHz) It is recommended that anote is made of this value. Note that the value of the frequency not being used is displayed as zero.6.12 ATTENUATION VALUE-METHOD 3Select the CALIBRATION /Manual Entry / Sensor to access the dB FACTOR value. This is the attenuation in dB perpercent solids for the size/type of sensor and the slurry in use. Typically this data would have come from anotherinstallation of the same type, or previous data on this installation, read from the Diagnostic Display Data screens.Enter the numerical value required.NB:It Is advisable to recheck the zero setting on the plant periodically (Every 6 months at least).23IP258