TABLE B–35.—Civilian population and labor force, 1929–2004[Monthly data seasonally adjusted, except as noted]Year or monthCiviliannoninstitutionalpopulation1TotalTotalCivilian labor forceEmploymentAgriculturalNonagriculturalUnemploymentNot inlaborforceCivilianlaborforceparticipationrate 2Civilianemployment/populationratio 3Unemploymentrate,civilianworkers4Thousands <strong>of</strong> persons 14 years <strong>of</strong> age and overPercent1929 .............................................................. ................ 49,180 47,630 10,450 37,180 1,550 ............ .......... .......... 3.21933 .............................................................. ................ 51,590 38,760 10,090 28,670 12,830 ............ .......... .......... 24.91939 .............................................................. ................ 55,230 45,750 9,610 36,140 9,480 ............ .......... .......... 17.21940 .............................................................. 99,840 55,640 47,520 9,540 37,980 8,120 44,200 55.7 47.6 14.61941 .............................................................. 99,900 55,910 50,350 9,100 41,250 5,560 43,990 56.0 50.4 9.91942 .............................................................. 98,640 56,410 53,750 9,250 44,500 2,660 42,230 57.2 54.5 4.71943 .............................................................. 94,640 55,540 54,470 9,080 45,390 1,070 39,100 58.7 57.6 1.91944 .............................................................. 93,220 54,630 53,960 8,950 45,010 670 38,590 58.6 57.9 1.21945 .............................................................. 94,090 53,860 52,820 8,580 44,240 1,040 40,230 57.2 56.1 1.91946 .............................................................. 103,070 57,520 55,250 8,320 46,930 2,270 45,550 55.8 53.6 3.91947 .............................................................. 106,018 60,168 57,812 8,256 49,557 2,356 45,850 56.8 54.5 3.9Thousands <strong>of</strong> persons 16 years <strong>of</strong> age and over1947 .............................................................. 101,827 59,350 57,038 7,890 49,148 2,311 42,477 58.3 56.0 3.91948 .............................................................. 103,068 60,621 58,343 7,629 50,714 2,276 42,447 58.8 56.6 3.81949 .............................................................. 103,994 61,286 57,651 7,658 49,993 3,637 42,708 58.9 55.4 5.91950 .............................................................. 104,995 62,208 58,918 7,160 51,758 3,288 42,787 59.2 56.1 5.31951 .............................................................. 104,621 62,017 59,961 6,726 53,235 2,055 42,604 59.2 57.3 3.31952 .............................................................. 105,231 62,138 60,250 6,500 53,749 1,883 43,093 59.0 57.3 3.01953 5 ........................................................... 107,056 63,015 61,179 6,260 54,919 1,834 44,041 58.9 57.1 2.91954 .............................................................. 108,321 63,643 60,109 6,205 53,904 3,532 44,678 58.8 55.5 5.51955 .............................................................. 109,683 65,023 62,170 6,450 55,722 2,852 44,660 59.3 56.7 4.41956 .............................................................. 110,954 66,552 63,799 6,283 57,514 2,750 44,402 60.0 57.5 4.11957 .............................................................. 112,265 66,929 64,071 5,947 58,123 2,859 45,336 59.6 57.1 4.31958 .............................................................. 113,727 67,639 63,036 5,586 57,450 4,602 46,088 59.5 55.4 6.81959 .............................................................. 115,329 68,369 64,630 5,565 59,065 3,740 46,960 59.3 56.0 5.51960 5 ........................................................... 117,245 69,628 65,778 5,458 60,318 3,852 47,617 59.4 56.1 5.51961 .............................................................. 118,771 70,459 65,746 5,200 60,546 4,714 48,312 59.3 55.4 6.71962 5 ........................................................... 120,153 70,614 66,702 4,944 61,759 3,911 49,539 58.8 55.5 5.51963 .............................................................. 122,416 71,833 67,762 4,687 63,076 4,070 50,583 58.7 55.4 5.71964 .............................................................. 124,485 73,091 69,305 4,523 64,782 3,786 51,394 58.7 55.7 5.21965 .............................................................. 126,513 74,455 71,088 4,361 66,726 3,366 52,058 58.9 56.2 4.51966 .............................................................. 128,058 75,770 72,895 3,979 68,915 2,875 52,288 59.2 56.9 3.81967 .............................................................. 129,874 77,347 74,372 3,844 70,527 2,975 52,527 59.6 57.3 3.81968 .............................................................. 132,028 78,737 75,920 3,817 72,103 2,817 53,291 59.6 57.5 3.61969 .............................................................. 134,335 80,734 77,902 3,606 74,296 2,832 53,602 60.1 58.0 3.51970 .............................................................. 137,085 82,771 78,678 3,463 75,215 4,093 54,315 60.4 57.4 4.91971 .............................................................. 140,216 84,382 79,367 3,394 75,972 5,016 55,834 60.2 56.6 5.91972 5 ........................................................... 144,126 87,034 82,153 3,484 78,669 4,882 57,091 60.4 57.0 5.61973 5 ........................................................... 147,096 89,429 85,064 3,470 81,594 4,365 57,667 60.8 57.8 4.91974 .............................................................. 150,120 91,949 86,794 3,515 83,279 5,156 58,171 61.3 57.8 5.61975 .............................................................. 153,153 93,775 85,846 3,408 82,438 7,929 59,377 61.2 56.1 8.51976 .............................................................. 156,150 96,158 88,752 3,331 85,421 7,406 59,991 61.6 56.8 7.71977 .............................................................. 159,033 99,009 92,017 3,283 88,734 6,991 60,025 62.3 57.9 7.11978 5 ........................................................... 161,910 102,251 96,048 3,387 92,661 6,202 59,659 63.2 59.3 6.11979 .............................................................. 164,863 104,962 98,824 3,347 95,477 6,137 59,900 63.7 59.9 5.81980 .............................................................. 167,745 106,940 99,303 3,364 95,938 7,637 60,806 63.8 59.2 7.11981 .............................................................. 170,130 108,670 100,397 3,368 97,030 8,273 61,460 63.9 59.0 7.61982 .............................................................. 172,271 110,204 99,526 3,401 96,125 10,678 62,067 64.0 57.8 9.71983 .............................................................. 174,215 111,550 100,834 3,383 97,450 10,717 62,665 64.0 57.9 9.61984 .............................................................. 176,383 113,544 105,005 3,321 101,685 8,539 62,839 64.4 59.5 7.51985 .............................................................. 178,206 115,461 107,150 3,179 103,971 8,312 62,744 64.8 60.1 7.21986 5 ........................................................... 180,587 117,834 109,597 3,163 106,434 8,237 62,752 65.3 60.7 7.01987 .............................................................. 182,753 119,865 112,440 3,208 109,232 7,425 62,888 65.6 61.5 6.21988 .............................................................. 184,613 121,669 114,968 3,169 111,800 6,701 62,944 65.9 62.3 5.51989 .............................................................. 186,393 123,869 117,342 3,199 114,142 6,528 62,523 66.5 63.0 5.31990 5 ........................................................... 189,164 125,840 118,793 3,223 115,570 7,047 63,324 66.5 62.8 5.61991 .............................................................. 190,925 126,346 117,718 3,269 114,449 8,628 64,578 66.2 61.7 6.81992 .............................................................. 192,805 128,105 118,492 3,247 115,245 9,613 64,700 66.4 61.5 7.51993 .............................................................. 194,838 129,200 120,259 3,115 117,144 8,940 65,638 66.3 61.7 6.91994 5 ........................................................... 196,814 131,056 123,060 3,409 119,651 7,996 65,758 66.6 62.5 6.11995 .............................................................. 198,584 132,304 124,900 3,440 121,460 7,404 66,280 66.6 62.9 5.61996 .............................................................. 200,591 133,943 126,708 3,443 123,264 7,236 66,647 66.8 63.2 5.41997 5 ........................................................... 203,133 136,297 129,558 3,399 126,159 6,739 66,837 67.1 63.8 4.91998 5 ........................................................... 205,220 137,673 131,463 3,378 128,085 6,210 67,547 67.1 64.1 4.51999 5 ........................................................... 207,753 139,368 133,488 3,281 130,207 5,880 68,385 67.1 64.3 4.21Not seasonally adjusted.2Civilian labor force as percent <strong>of</strong> civilian noninstitutional population.3Civilian employment as percent <strong>of</strong> civilian noninstitutional population.4Unemployed as percent <strong>of</strong> civilian labor force.See next page for continuation <strong>of</strong> table.252
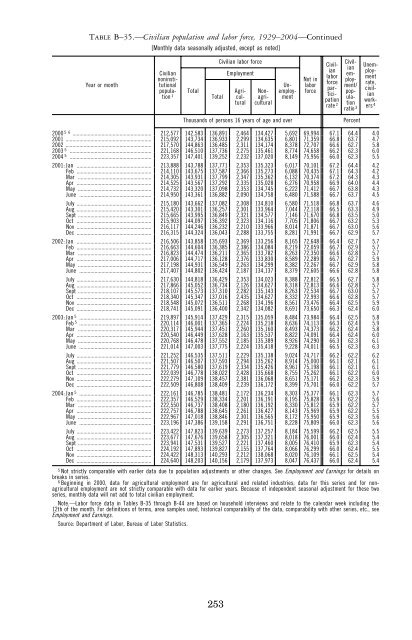
TABLE B–35.—Civilian population and labor force, 1929–2004—Continued[Monthly data seasonally adjusted, except as noted]Year or monthCiviliannoninstitutionalpopulation1TotalTotalCivilian labor forceEmploymentAgriculturalNonagriculturalUnemploymentNot inlaborforceCivilianlaborforceparticipationrate 2Civilianemployment/populationratio 3Unemploymentrate,civilianworkers4Thousands <strong>of</strong> persons 16 years <strong>of</strong> age and overPercent2000 56 ......................................................... 212,577 142,583 136,891 2,464 134,427 5,692 69,994 67.1 64.4 4.02001 .............................................................. 215,092 143,734 136,933 2,299 134,635 6,801 71,359 66.8 63.7 4.72002 .............................................................. 217,570 144,863 136,485 2,311 134,174 8,378 72,707 66.6 62.7 5.82003 5 ........................................................... 221,168 146,510 137,736 2,275 135,461 8,774 74,658 66.2 62.3 6.02004 5 ........................................................... 223,357 147,401 139,252 2,232 137,020 8,149 75,956 66.0 62.3 5.52001: Jan ...................................................... 213,888 143,788 137,771 2,353 135,323 6,017 70,101 67.2 64.4 4.2Feb ...................................................... 214,110 143,675 137,587 2,366 135,273 6,088 70,435 67.1 64.3 4.2Mar ..................................................... 214,305 143,931 137,799 2,347 135,362 6,132 70,374 67.2 64.3 4.3Apr ...................................................... 214,525 143,567 137,292 2,335 135,028 6,276 70,958 66.9 64.0 4.4May ..................................................... 214,732 143,320 137,098 2,353 134,745 6,222 71,412 66.7 63.8 4.3June .................................................... 214,950 143,361 136,882 2,090 134,758 6,480 71,588 66.7 63.7 4.5July ...................................................... 215,180 143,662 137,082 2,308 134,810 6,580 71,518 66.8 63.7 4.6Aug ...................................................... 215,420 143,301 136,257 2,301 133,964 7,044 72,118 66.5 63.3 4.9Sept ..................................................... 215,665 143,995 136,849 2,321 134,577 7,146 71,670 66.8 63.5 5.0Oct ...................................................... 215,903 144,097 136,392 2,323 134,116 7,705 71,806 66.7 63.2 5.3Nov ...................................................... 216,117 144,246 136,232 2,210 133,966 8,014 71,871 66.7 63.0 5.6Dec ...................................................... 216,315 144,324 136,043 2,288 133,755 8,281 71,991 66.7 62.9 5.72002: Jan ...................................................... 216,506 143,858 135,693 2,369 133,256 8,165 72,648 66.4 62.7 5.7Feb ...................................................... 216,663 144,604 136,385 2,386 134,084 8,219 72,059 66.7 62.9 5.7Mar ..................................................... 216,823 144,474 136,211 2,365 133,782 8,263 72,350 66.6 62.8 5.7Apr ...................................................... 217,006 144,717 136,128 2,376 133,830 8,589 72,289 66.7 62.7 5.9May ..................................................... 217,198 144,931 136,549 2,263 134,299 8,382 72,267 66.7 62.9 5.8June .................................................... 217,407 144,802 136,424 2,187 134,137 8,379 72,605 66.6 62.8 5.8July ...................................................... 217,630 144,818 136,429 2,353 134,023 8,388 72,812 66.5 62.7 5.8Aug ...................................................... 217,866 145,052 136,734 2,126 134,627 8,318 72,813 66.6 62.8 5.7Sept ..................................................... 218,107 145,573 137,310 2,282 135,143 8,263 72,534 66.7 63.0 5.7Oct ...................................................... 218,340 145,347 137,016 2,435 134,627 8,332 72,993 66.6 62.8 5.7Nov ...................................................... 218,548 145,072 136,511 2,268 134,196 8,561 73,476 66.4 62.5 5.9Dec ...................................................... 218,741 145,091 136,400 2,342 134,082 8,691 73,650 66.3 62.4 6.02003: Jan 5 .................................................... 219,897 145,914 137,429 2,315 135,059 8,484 73,984 66.4 62.5 5.8Feb 5 .................................................... 220,114 146,001 137,365 2,224 135,218 8,636 74,113 66.3 62.4 5.9Mar ..................................................... 220,317 145,944 137,451 2,260 135,160 8,493 74,373 66.2 62.4 5.8Apr ...................................................... 220,540 146,449 137,628 2,163 135,537 8,822 74,091 66.4 62.4 6.0May ..................................................... 220,768 146,478 137,552 2,185 135,389 8,926 74,290 66.3 62.3 6.1June .................................................... 221,014 147,003 137,775 2,224 135,418 9,228 74,011 66.5 62.3 6.3July ...................................................... 221,252 146,535 137,511 2,229 135,138 9,024 74,717 66.2 62.2 6.2Aug ...................................................... 221,507 146,507 137,593 2,294 135,262 8,914 75,000 66.1 62.1 6.1Sept ..................................................... 221,779 146,580 137,619 2,334 135,426 8,961 75,198 66.1 62.1 6.1Oct ...................................................... 222,039 146,778 138,022 2,428 135,668 8,755 75,262 66.1 62.2 6.0Nov ...................................................... 222,279 147,109 138,457 2,381 136,068 8,651 75,171 66.2 62.3 5.9Dec ...................................................... 222,509 146,808 138,409 2,239 136,172 8,399 75,701 66.0 62.2 5.72004: Jan 5 .................................................... 222,161 146,785 138,481 2,172 136,234 8,303 75,377 66.1 62.3 5.7Feb ...................................................... 222,357 146,529 138,334 2,201 136,191 8,195 75,828 65.9 62.2 5.6Mar ..................................................... 222,550 146,737 138,408 2,180 136,192 8,330 75,812 65.9 62.2 5.7Apr ...................................................... 222,757 146,788 138,645 2,261 136,427 8,143 75,969 65.9 62.2 5.5May ..................................................... 222,967 147,018 138,846 2,301 136,565 8,172 75,950 65.9 62.3 5.6June .................................................... 223,196 147,386 139,158 2,291 136,751 8,228 75,809 66.0 62.3 5.6July ...................................................... 223,422 147,823 139,639 2,273 137,257 8,184 75,599 66.2 62.5 5.5Aug ...................................................... 223,677 147,676 139,658 2,305 137,321 8,018 76,001 66.0 62.4 5.4Sept ..................................................... 223,941 147,531 139,527 2,221 137,460 8,005 76,410 65.9 62.3 5.4Oct ...................................................... 224,192 147,893 139,827 2,155 137,764 8,066 76,299 66.0 62.4 5.5Nov ...................................................... 224,422 148,313 140,293 2,212 138,068 8,020 76,109 66.1 62.5 5.4Dec ...................................................... 224,640 148,203 140,156 2,179 137,973 8,047 76,437 66.0 62.4 5.45Not strictly comparable with earlier data due to population adjustments or o<strong>the</strong>r changes. See Employment and Earnings for details onbreaks in series.6Beginning in 2000, data for agricultural employment are for agricultural and related industries; data for this series and for nonagriculturalemployment are not strictly comparable with data for earlier years. Because <strong>of</strong> independent seasonal adjustment for <strong>the</strong>se twoseries, monthly data will not add to total civilian employment.Note.—Labor force data in Tables B-35 through B-44 are based on household interviews and relate to <strong>the</strong> calendar week including <strong>the</strong>12th <strong>of</strong> <strong>the</strong> month. For definitions <strong>of</strong> terms, area samples used, historical comparability <strong>of</strong> <strong>the</strong> data, comparability with o<strong>the</strong>r series, etc., seeEmployment and Earnings.Source: Department <strong>of</strong> Labor, Bureau <strong>of</strong> Labor Statistics.253
- Page 1 and 2:
Economic Reportof the PresidentTran
- Page 3 and 4:
C O N T E N T SECONOMIC REPORT OF T
- Page 5 and 6:
ECONOMIC REPORT OF THE PRESIDENTTo
- Page 7 and 8:
the playing field is level for our
- Page 9 and 10:
LETTER OF TRANSMITTALCOUNCIL OF ECO
- Page 11 and 12:
Monetary Policy ...................
- Page 13 and 14:
Encouraging FDI ...................
- Page 15 and 16:
3-4. The Equivalence of Sales Taxes
- Page 17 and 18:
Real GDP expanded by 3.7 percent du
- Page 19 and 20:
Options for Tax ReformChapter 3, Op
- Page 21 and 22:
and better Nation for it. A compreh
- Page 23 and 24:
Innovation and the Information Econ
- Page 25 and 26:
ecause they do not expect family me
- Page 27 and 28:
The Administration has pushed aggre
- Page 29 and 30:
C H A P T E R 1The Year in Review a
- Page 31 and 32:
Consumer SpendingConsumer spending
- Page 33 and 34:
easons for this correlation are dis
- Page 35 and 36:
2003, a number of countries that to
- Page 37 and 38:
ProductivityRecent productivity gro
- Page 39 and 40:
The projected path of inflation as
- Page 41 and 42:
strengthen. The forecast is based o
- Page 43 and 44:
The growth rate of the economy over
- Page 45 and 46:
In sum, potential real GDP is proje
- Page 47 and 48:
C H A P T E R 2Expansions Past and
- Page 49 and 50:
The behavior of real GDP is similar
- Page 51 and 52:
of faltering may be attributable to
- Page 53 and 54:
most recent expansions have shown r
- Page 55 and 56:
middle of 2003. The more moderate r
- Page 57 and 58:
1.2 percent. Employment continued t
- Page 59 and 60:
SummaryModerate recessions are foll
- Page 61 and 62:
permanent cuts should permanently r
- Page 63 and 64:
and the Jobs and Growth Tax Relief
- Page 65 and 66:
Federal government revenues had bee
- Page 67 and 68:
Fiscal policy played an especially
- Page 69 and 70:
C H A P T E R 3Options for Tax Refo
- Page 71 and 72:
High Compliance CostsThe complexity
- Page 73 and 74:
a reasonable estimate is that a 10
- Page 75 and 76:
Excess BurdenBecause taxes distort
- Page 77 and 78:
Box 3-3 — continuedThe bottom 40
- Page 79 and 80:
more uniform or pure version of the
- Page 81 and 82:
of being collected all at once at t
- Page 83 and 84:
would have to differ from state tax
- Page 85 and 86:
owner claimed it was for business,
- Page 87 and 88:
The current set of saving incentive
- Page 89 and 90:
the current system. In addition, so
- Page 91 and 92:
C H A P T E R 4ImmigrationIn recent
- Page 93 and 94:
TABLE 4-1.— Foreign-Born Share of
- Page 95 and 96:
immigrants (also called illegal or
- Page 97 and 98:
largest group of immigrants was bor
- Page 99 and 100:
employment costs, including wage fl
- Page 101 and 102:
Chapter 4 | 103
- Page 103 and 104:
wages fall in response to immigrati
- Page 105 and 106:
immigrants from Latin America do re
- Page 107 and 108:
addition, as migrants leave the cou
- Page 109 and 110:
include siblings and adult children
- Page 111 and 112:
despite the tremendous growth in th
- Page 113 and 114:
The TWP would allow new foreign wor
- Page 115 and 116:
C H A P T E R 5Expanding Individual
- Page 117 and 118:
This phenomenon, known as the “tr
- Page 119 and 120:
producing more of that good. Simila
- Page 121 and 122:
In 2002, the President proposed “
- Page 123 and 124:
provide evidence of increased profi
- Page 125 and 126:
schools are four times as efficient
- Page 127 and 128:
low administrative costs, estimated
- Page 129 and 130:
Box 5-2: The Benefits of Land Title
- Page 131 and 132:
development plan designed by others
- Page 133 and 134:
C H A P T E R 6Innovation and theIn
- Page 135 and 136:
E-mail is the most common online ac
- Page 137 and 138:
Changed circumstances, such as new
- Page 139 and 140:
Illegal Acts on the InternetThe Int
- Page 141 and 142:
or develop new markets, which can l
- Page 143 and 144:
inflation factor for the price cap
- Page 145 and 146:
U.S. households connecting to local
- Page 147 and 148:
garbling their transmissions. To li
- Page 149 and 150:
from 51.3 percent in December 1999
- Page 151 and 152:
for their property rights. The Admi
- Page 153 and 154:
C H A P T E R 7The Global HIV/AIDS
- Page 155 and 156:
Chart 7-1 Estimated HIV Infection L
- Page 157 and 158:
There is no cure for HIV/AIDS, thou
- Page 159 and 160:
AIDS is more damaging to a househol
- Page 161 and 162:
and risk reduction have helped redu
- Page 163 and 164:
only one price, the drug companies
- Page 165 and 166:
Box 7-1 — continuedfocused on the
- Page 167 and 168:
Box 7-2 — continuedenhancing coor
- Page 169 and 170:
ConclusionThe United States and cou
- Page 171 and 172:
Good Two. In Ricardo’s simple mod
- Page 173 and 174:
The Impact of Trade on Labor Market
- Page 175 and 176:
The U.S. Advantage in Services Trad
- Page 177 and 178:
U.S. firms is associated with a cor
- Page 179 and 180:
anked the second-best country out o
- Page 181 and 182:
the Chinese government agreed to el
- Page 183 and 184:
Trade LiberalizationTariffs and oth
- Page 185 and 186:
ConclusionThe United States is the
- Page 187 and 188:
LETTER OF TRANSMITTALCOUNCIL OF ECO
- Page 189 and 190:
Report to the President on theActiv
- Page 191 and 192:
The Council continued its efforts t
- Page 193 and 194:
The Staff of the Council of Economi
- Page 195 and 196:
John List and Ted Gayer provided co
- Page 197: Appendix BSTATISTICAL TABLES RELATI
- Page 200 and 201: PageB-32. Gross saving and investme
- Page 202 and 203: PageB-94. Relation of profits after
- Page 204 and 205: NATIONAL INCOME OR EXPENDITURETABLE
- Page 206 and 207: TABLE B-2.—Real gross domestic pr
- Page 208 and 209: TABLE B-3.—Quantity and price ind
- Page 210 and 211: TABLE B-5.—Contributions to perce
- Page 212 and 213: TABLE B-6.—Chain-type quantity in
- Page 214 and 215: TABLE B-7.—Chain-type price index
- Page 216 and 217: TABLE B-8.—Gross domestic product
- Page 218 and 219: TABLE B-10.—Gross value added by
- Page 220 and 221: TABLE B-12.—Gross domestic produc
- Page 222 and 223: TABLE B-13.—Real gross domestic p
- Page 224 and 225: TABLE B-14.—Gross value added of
- Page 226 and 227: TABLE B-16.—Personal consumption
- Page 228 and 229: TABLE B-18.—Private fixed investm
- Page 230 and 231: TABLE B-20.—Government consumptio
- Page 232 and 233: TABLE B-22.—Private inventories a
- Page 234 and 235: TABLE B-24.—Foreign transactions
- Page 236 and 237: TABLE B-26.—Relation of gross dom
- Page 238 and 239: TABLE B-28.—National income by ty
- Page 240 and 241: TABLE B-29.—Sources of personal i
- Page 242 and 243: TABLE B-30.—Disposition of person
- Page 244 and 245: Year or quarterTABLE B-32.—Gross
- Page 246 and 247: TABLE B-33.—Median money income (
- Page 250 and 251: TABLE B-36.—Civilian employment a
- Page 252 and 253: TABLE B-38.—Unemployment by demog
- Page 254 and 255: TABLE B-40.—Civilian labor force
- Page 256 and 257: TABLE B-42.—Civilian unemployment
- Page 258 and 259: TABLE B-44.—Unemployment by durat
- Page 260 and 261: TABLE B-46.—Employees on nonagric
- Page 262 and 263: TABLE B-47.—Hours and earnings in
- Page 264 and 265: Year orquarterTABLE B-49.—Product
- Page 266 and 267: PRODUCTION AND BUSINESS ACTIVITYTAB
- Page 268 and 269: Year ormonthTABLE B-53.—Industria
- Page 270 and 271: Year or monthTABLE B-55.—New cons
- Page 272 and 273: TABLE B-57.—Manufacturing and tra
- Page 274 and 275: TABLE B-59.—Manufacturers’ new
- Page 276 and 277: Year ormonthTABLE B-61.—Consumer
- Page 278 and 279: TABLE B-62.—Consumer price indexe
- Page 280 and 281: TABLE B-64.—Changes in consumer p
- Page 282 and 283: TABLE B-65.—Producer price indexe
- Page 284 and 285: TABLE B-67.—Producer price indexe
- Page 286 and 287: TABLE B-68.—Changes in producer p
- Page 288 and 289: TABLE B-70.—Components of money s
- Page 290 and 291: TABLE B-71.—Aggregate reserves of
- Page 292 and 293: TABLE B-73.—Bond yields and inter
- Page 294 and 295: TABLE B-74.—Credit market borrowi
- Page 296 and 297: TABLE B-75.—Mortgage debt outstan
- Page 298 and 299:
TABLE B-77.—Consumer credit outst
- Page 300 and 301:
TABLE B-79.—Federal receipts, out
- Page 302 and 303:
TABLE B-81.—Federal receipts, out
- Page 304 and 305:
TABLE B-83.—Federal and State and
- Page 306 and 307:
TABLE B-85.—State and local gover
- Page 308 and 309:
End of yearor monthTABLE B-87.—U.
- Page 310 and 311:
End of monthTABLE B-89.—Estimated
- Page 312 and 313:
TABLE B-91.—Corporate profits by
- Page 314 and 315:
TABLE B-93.—Sales, profits, and s
- Page 316 and 317:
YearComposite(Dec. 31,2002=5,000) 3
- Page 318 and 319:
YearAGRICULTURETABLE B-97.—Farm i
- Page 320 and 321:
TABLE B-99.—Farm output and produ
- Page 322 and 323:
Year ormonthTABLE B-101.—Agricult
- Page 324 and 325:
INTERNATIONAL STATISTICSTABLE B-103
- Page 326 and 327:
TABLE B-104.—U.S. international t
- Page 328 and 329:
TABLE B-106.—U.S. international t
- Page 330 and 331:
TABLE B-108.—Industrial productio
- Page 332 and 333:
TABLE B-110.—Foreign exchange rat
- Page 334:
TABLE B-112.—Growth rates in real