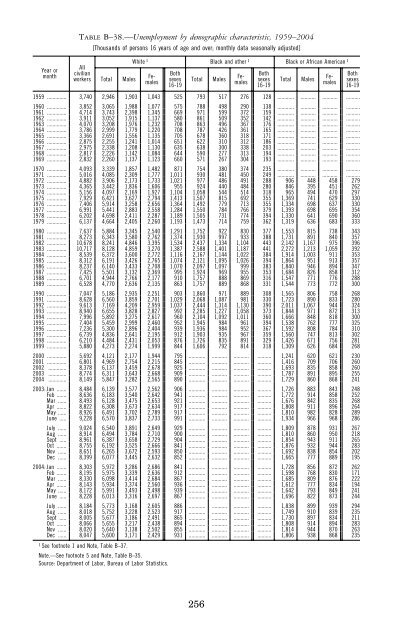
TABLE B–38.—Unemployment by demographic characteristic, 1959–2004[Thousands <strong>of</strong> persons 16 years <strong>of</strong> age and over; monthly data seasonally adjusted]Year ormonthAllcivilianworkersTotalMalesWhite 1 Black and o<strong>the</strong>r 1 Black or African American 1FemalesBothsexes16-19TotalMalesFemalesBothsexes16-19TotalMalesFemalesBothsexes16-191959 .............. 3,740 2,946 1,903 1,043 525 793 517 276 128 ............ ........... ........... ..........1960 .............. 3,852 3,065 1,988 1,077 575 788 498 290 138 ............ ........... ........... ..........1961 .............. 4,714 3,743 2,398 1,345 669 971 599 372 159 ............ ........... ........... ..........1962 .............. 3,911 3,052 1,915 1,137 580 861 509 352 142 ............ ........... ........... ..........1963 .............. 4,070 3,208 1,976 1,232 708 863 496 367 176 ............ ........... ........... ..........1964 .............. 3,786 2,999 1,779 1,220 708 787 426 361 165 ............ ........... ........... ..........1965 .............. 3,366 2,691 1,556 1,135 705 678 360 318 171 ............ ........... ........... ..........1966 .............. 2,875 2,255 1,241 1,014 651 622 310 312 186 ............ ........... ........... ..........1967 .............. 2,975 2,338 1,208 1,130 635 638 300 338 203 ............ ........... ........... ..........1968 .............. 2,817 2,226 1,142 1,084 644 590 277 313 194 ............ ........... ........... ..........1969 .............. 2,832 2,260 1,137 1,123 660 571 267 304 193 ............ ........... ........... ..........1970 .............. 4,093 3,339 1,857 1,482 871 754 380 374 235 ............ ........... ........... ..........1971 .............. 5,016 4,085 2,309 1,777 1,011 930 481 450 249 ............ ........... ........... ..........1972 .............. 4,882 3,906 2,173 1,733 1,021 977 486 491 288 906 448 458 2791973 .............. 4,365 3,442 1,836 1,606 955 924 440 484 280 846 395 451 2621974 .............. 5,156 4,097 2,169 1,927 1,104 1,058 544 514 318 965 494 470 2971975 .............. 7,929 6,421 3,627 2,794 1,413 1,507 815 692 355 1,369 741 629 3301976 .............. 7,406 5,914 3,258 2,656 1,364 1,492 779 713 355 1,334 698 637 3301977 .............. 6,991 5,441 2,883 2,558 1,284 1,550 784 766 379 1,393 698 695 3541978 .............. 6,202 4,698 2,411 2,287 1,189 1,505 731 774 394 1,330 641 690 3601979 .............. 6,137 4,664 2,405 2,260 1,193 1,473 714 759 362 1,319 636 683 3331980 .............. 7,637 5,884 3,345 2,540 1,291 1,752 922 830 377 1,553 815 738 3431981 .............. 8,273 6,343 3,580 2,762 1,374 1,930 997 933 388 1,731 891 840 3571982 .............. 10,678 8,241 4,846 3,395 1,534 2,437 1,334 1,104 443 2,142 1,167 975 3961983 .............. 10,717 8,128 4,859 3,270 1,387 2,588 1,401 1,187 441 2,272 1,213 1,059 3921984 .............. 8,539 6,372 3,600 2,772 1,116 2,167 1,144 1,022 384 1,914 1,003 911 3531985 .............. 8,312 6,191 3,426 2,765 1,074 2,121 1,095 1,026 394 1,864 951 913 3571986 .............. 8,237 6,140 3,433 2,708 1,070 2,097 1,097 999 383 1,840 946 894 3471987 .............. 7,425 5,501 3,132 2,369 995 1,924 969 955 353 1,684 826 858 3121988 .............. 6,701 4,944 2,766 2,177 910 1,757 888 869 316 1,547 771 776 2881989 .............. 6,528 4,770 2,636 2,135 863 1,757 889 868 331 1,544 773 772 3001990 .............. 7,047 5,186 2,935 2,251 903 1,860 971 889 308 1,565 806 758 2681991 .............. 8,628 6,560 3,859 2,701 1,029 2,068 1,087 981 330 1,723 890 833 2801992 .............. 9,613 7,169 4,209 2,959 1,037 2,444 1,314 1,130 390 2,011 1,067 944 3241993 .............. 8,940 6,655 3,828 2,827 992 2,285 1,227 1,058 373 1,844 971 872 3131994 .............. 7,996 5,892 3,275 2,617 960 2,104 1,092 1,011 360 1,666 848 818 3001995 .............. 7,404 5,459 2,999 2,460 952 1,945 984 961 394 1,538 762 777 3251996 .............. 7,236 5,300 2,896 2,404 939 1,936 984 952 367 1,592 808 784 3101997 .............. 6,739 4,836 2,641 2,195 912 1,903 935 967 359 1,560 747 813 3021998 .............. 6,210 4,484 2,431 2,053 876 1,726 835 891 329 1,426 671 756 2811999 .............. 5,880 4,273 2,274 1,999 844 1,606 792 814 318 1,309 626 684 2682000 .............. 5,692 4,121 2,177 1,944 795 ............ ........... ........... .......... 1,241 620 621 2302001 .............. 6,801 4,969 2,754 2,215 845 ............ ........... ........... .......... 1,416 709 706 2602002 ............. 8,378 6,137 3,459 2,678 925 ............ ........... ........... .......... 1,693 835 858 2602003 ............. 8,774 6,311 3,643 2,668 909 ............ ........... ........... .......... 1,787 891 895 2552004 ............. 8,149 5,847 3,282 2,565 890 ............ ........... ........... .......... 1,729 860 868 2412003: Jan ....... 8,484 6,139 3,577 2,562 906 ............ ........... ........... .......... 1,726 883 843 248Feb ....... 8,636 6,183 3,540 2,642 941 ............ ........... ........... .......... 1,772 914 858 252Mar ...... 8,493 6,128 3,475 2,653 921 ............ ........... ........... .......... 1,676 842 835 268Apr ....... 8,822 6,308 3,673 2,634 917 ............ ........... ........... .......... 1,808 911 896 264May ...... 8,926 6,491 3,702 2,789 917 ............ ........... ........... .......... 1,810 982 828 289June ..... 9,228 6,570 3,837 2,733 991 ............ ........... ........... .......... 1,934 966 968 286July ...... 9,024 6,540 3,891 2,649 929 ............ ........... ........... .......... 1,809 878 931 267Aug ...... 8,914 6,494 3,784 2,710 900 ............ ........... ........... .......... 1,810 860 950 218Sept ..... 8,961 6,387 3,658 2,729 904 ............ ........... ........... .......... 1,854 943 911 265Oct ....... 8,755 6,192 3,525 2,666 841 ............ ........... ........... .......... 1,876 932 944 283Nov ...... 8,651 6,265 3,672 2,593 850 ............ ........... ........... .......... 1,692 838 854 202Dec ...... 8,399 6,077 3,445 2,632 852 ............ ........... ........... .......... 1,665 777 889 1952004: Jan ....... 8,303 5,972 3,286 2,686 841 ............ ........... ........... .......... 1,728 856 872 262Feb ....... 8,195 5,975 3,339 2,636 912 ............ ........... ........... .......... 1,598 768 830 171Mar ...... 8,330 6,098 3,414 2,684 867 ............ ........... ........... .......... 1,685 809 876 222Apr ....... 8,143 5,934 3,374 2,560 936 ............ ........... ........... .......... 1,612 777 834 194May ...... 8,172 5,991 3,493 2,498 939 ............ ........... ........... .......... 1,642 793 849 241June ..... 8,228 6,013 3,316 2,697 867 ............ ........... ........... .......... 1,696 822 873 244July ...... 8,184 5,773 3,168 2,605 886 ............ ........... ........... .......... 1,838 899 939 294Aug ...... 8,018 5,752 3,228 2,523 917 ............ ........... ........... .......... 1,749 910 839 235Sept ..... 8,005 5,677 3,186 2,491 865 ............ ........... ........... .......... 1,730 897 834 211Oct ....... 8,066 5,655 3,217 2,438 894 ............ ........... ........... .......... 1,808 914 894 283Nov ...... 8,020 5,640 3,138 2,502 855 ............ ........... ........... .......... 1,814 944 870 263Dec ...... 8,047 5,600 3,171 2,429 931 ............ ........... ........... .......... 1,806 938 868 2351See footnote 1 and Note, Table B–37.Note.—See footnote 5 and Note, Table B–35.Source: Department <strong>of</strong> Labor, Bureau <strong>of</strong> Labor Statistics.256
TABLE B–39.—Civilian labor force participation rate and employment/population ratio, 1959–2004[Percent; 1 monthly data seasonally adjusted]Labor force participation rateEmployment/population ratioYear ormonthAllcivilianworkersMalesFemalesBothsexes16–19yearsWhite 2Blackando<strong>the</strong>r 2BlackorAfricanAmerican2AllcivilianworkersMalesFemalesBothsexes16–19yearsWhite 2Blackando<strong>the</strong>r 2BlackorAfricanAmerican21959 ....................... 59.3 83.7 37.1 46.7 58.7 64.3 ............ 56.0 79.3 35.0 39.9 55.9 57.5 ............1960 ....................... 59.4 83.3 37.7 47.5 58.8 64.5 ............ 56.1 78.9 35.5 40.5 55.9 57.9 ............1961 ....................... 59.3 82.9 38.1 46.9 58.8 64.1 ............ 55.4 77.6 35.4 39.1 55.3 56.2 ............1962 ....................... 58.8 82.0 37.9 46.1 58.3 63.2 ............ 55.5 77.7 35.6 39.4 55.4 56.3 ............1963 ....................... 58.7 81.4 38.3 45.2 58.2 63.0 ............ 55.4 77.1 35.8 37.4 55.3 56.2 ............1964 ....................... 58.7 81.0 38.7 44.5 58.2 63.1 ............ 55.7 77.3 36.3 37.3 55.5 57.0 ............1965 ....................... 58.9 80.7 39.3 45.7 58.4 62.9 ............ 56.2 77.5 37.1 38.9 56.0 57.8 ............1966 ....................... 59.2 80.4 40.3 48.2 58.7 63.0 ............ 56.9 77.9 38.3 42.1 56.8 58.4 ............1967 ....................... 59.6 80.4 41.1 48.4 59.2 62.8 ............ 57.3 78.0 39.0 42.2 57.2 58.2 ............1968 ....................... 59.6 80.1 41.6 48.3 59.3 62.2 ............ 57.5 77.8 39.6 42.2 57.4 58.0 ............1969 ....................... 60.1 79.8 42.7 49.4 59.9 62.1 ............ 58.0 77.6 40.7 43.4 58.0 58.1 ............1970 ....................... 60.4 79.7 43.3 49.9 60.2 61.8 ............ 57.4 76.2 40.8 42.3 57.5 56.8 ............1971 ....................... 60.2 79.1 43.4 49.7 60.1 60.9 ............ 56.6 74.9 40.4 41.3 56.8 54.9 ............1972 ....................... 60.4 78.9 43.9 51.9 60.4 60.2 59.9 57.0 75.0 41.0 43.5 57.4 54.1 53.71973 ....................... 60.8 78.8 44.7 53.7 60.8 60.5 60.2 57.8 75.5 42.0 45.9 58.2 55.0 54.51974 ....................... 61.3 78.7 45.7 54.8 61.4 60.3 59.8 57.8 74.9 42.6 46.0 58.3 54.3 53.51975 ....................... 61.2 77.9 46.3 54.0 61.5 59.6 58.8 56.1 71.7 42.0 43.3 56.7 51.4 50.11976 ....................... 61.6 77.5 47.3 54.5 61.8 59.8 59.0 56.8 72.0 43.2 44.2 57.5 52.0 50.81977 ....................... 62.3 77.7 48.4 56.0 62.5 60.4 59.8 57.9 72.8 44.5 46.1 58.6 52.5 51.41978 ....................... 63.2 77.9 50.0 57.8 63.3 62.2 61.5 59.3 73.8 46.4 48.3 60.0 54.7 53.61979 ....................... 63.7 77.8 50.9 57.9 63.9 62.2 61.4 59.9 73.8 47.5 48.5 60.6 55.2 53.81980 ....................... 63.8 77.4 51.5 56.7 64.1 61.7 61.0 59.2 72.0 47.7 46.6 60.0 53.6 52.31981 ....................... 63.9 77.0 52.1 55.4 64.3 61.3 60.8 59.0 71.3 48.0 44.6 60.0 52.6 51.31982 ....................... 64.0 76.6 52.6 54.1 64.3 61.6 61.0 57.8 69.0 47.7 41.5 58.8 50.9 49.41983 ....................... 64.0 76.4 52.9 53.5 64.3 62.1 61.5 57.9 68.8 48.0 41.5 58.9 51.0 49.51984 ....................... 64.4 76.4 53.6 53.9 64.6 62.6 62.2 59.5 70.7 49.5 43.7 60.5 53.6 52.31985 ....................... 64.8 76.3 54.5 54.5 65.0 63.3 62.9 60.1 70.9 50.4 44.4 61.0 54.7 53.41986 ....................... 65.3 76.3 55.3 54.7 65.5 63.7 63.3 60.7 71.0 51.4 44.6 61.5 55.4 54.11987 ....................... 65.6 76.2 56.0 54.7 65.8 64.3 63.8 61.5 71.5 52.5 45.5 62.3 56.8 55.61988 ....................... 65.9 76.2 56.6 55.3 66.2 64.0 63.8 62.3 72.0 53.4 46.8 63.1 57.4 56.31989 ....................... 66.5 76.4 57.4 55.9 66.7 64.7 64.2 63.0 72.5 54.3 47.5 63.8 58.2 56.91990 ....................... 66.5 76.4 57.5 53.7 66.9 64.4 64.0 62.8 72.0 54.3 45.3 63.7 57.9 56.71991 ....................... 66.2 75.8 57.4 51.6 66.6 63.8 63.3 61.7 70.4 53.7 42.0 62.6 56.7 55.41992 ....................... 66.4 75.8 57.8 51.3 66.8 64.6 63.9 61.5 69.8 53.8 41.0 62.4 56.4 54.91993 ....................... 66.3 75.4 57.9 51.5 66.8 63.8 63.2 61.7 70.0 54.1 41.7 62.7 56.3 55.01994 ....................... 66.6 75.1 58.8 52.7 67.1 63.9 63.4 62.5 70.4 55.3 43.4 63.5 57.2 56.11995 ....................... 66.6 75.0 58.9 53.5 67.1 64.3 63.7 62.9 70.8 55.6 44.2 63.8 58.1 57.11996 ....................... 66.8 74.9 59.3 52.3 67.2 64.6 64.1 63.2 70.9 56.0 43.5 64.1 58.6 57.41997 ....................... 67.1 75.0 59.8 51.6 67.5 65.2 64.7 63.8 71.3 56.8 43.4 64.6 59.4 58.21998 ....................... 67.1 74.9 59.8 52.8 67.3 66.0 65.6 64.1 71.6 57.1 45.1 64.7 60.9 59.71999 ....................... 67.1 74.7 60.0 52.0 67.3 65.9 65.8 64.3 71.6 57.4 44.7 64.8 61.3 60.62000 ....................... 67.1 74.8 59.9 52.0 67.3 .......... 65.8 64.4 71.9 57.5 45.2 64.9 .......... 60.92001 ....................... 66.8 74.4 59.8 49.6 67.0 .......... 65.3 63.7 70.9 57.0 42.3 64.2 .......... 59.72002 ....................... 66.6 74.1 59.6 47.4 66.8 .......... 64.8 62.7 69.7 56.3 39.6 63.4 .......... 58.12003 ....................... 66.2 73.5 59.5 44.5 66.5 .......... 64.3 62.3 68.9 56.1 36.8 63.0 .......... 57.42004 ....................... 66.0 73.3 59.2 43.9 66.3 .......... 63.8 62.3 69.2 56.0 36.4 63.1 .......... 57.22003: Jan ............... 66.4 73.5 59.8 45.8 66.6 .......... 64.5 62.5 68.9 56.5 38.0 63.2 .......... 57.7Feb ............... 66.3 73.6 59.6 45.6 66.6 .......... 64.4 62.4 69.1 56.2 37.7 63.2 .......... 57.5Mar .............. 66.2 73.4 59.6 44.8 66.6 .......... 64.0 62.4 69.0 56.3 37.0 63.2 .......... 57.4Apr ............... 66.4 73.7 59.7 45.1 66.7 .......... 64.7 62.4 69.0 56.3 37.0 63.2 .......... 57.7May .............. 66.3 73.6 59.6 44.9 66.5 .......... 65.0 62.3 68.9 56.2 36.9 63.0 .......... 58.0June ............. 66.5 73.7 59.9 45.2 66.7 .......... 64.9 62.3 68.7 56.4 36.7 63.0 .......... 57.4July ............... 66.2 73.5 59.5 44.4 66.5 .......... 64.4 62.2 68.6 56.1 36.3 62.9 .......... 57.4Aug ............... 66.1 73.3 59.5 43.8 66.4 .......... 64.4 62.1 68.6 56.1 36.5 62.8 .......... 57.3Sept .............. 66.1 73.5 59.2 44.1 66.2 .......... 64.6 62.1 68.9 55.7 36.3 62.7 .......... 57.4Oct ............... 66.1 73.4 59.3 43.6 66.4 .......... 64.0 62.2 68.9 56.0 36.1 62.9 .......... 56.8Nov ............... 66.2 73.6 59.3 44.0 66.5 .......... 63.8 62.3 69.0 56.0 37.0 63.0 .......... 57.3Dec ............... 66.0 73.5 59.0 43.0 66.3 .......... 63.2 62.2 69.2 55.7 36.1 62.9 .......... 56.82004: Jan ............... 66.1 73.6 59.1 44.4 66.4 .......... 64.2 62.3 69.4 55.8 36.9 63.1 .......... 57.5Feb ............... 65.9 73.1 59.2 43.5 66.3 .......... 63.4 62.2 69.0 55.9 36.3 63.0 .......... 57.3Mar .............. 65.9 73.3 59.1 43.1 66.2 .......... 64.0 62.2 69.0 55.8 36.0 62.9 .......... 57.5Apr ............... 65.9 73.1 59.1 43.9 66.2 .......... 63.6 62.2 69.0 55.9 36.4 63.0 .......... 57.4May .............. 65.9 73.2 59.2 43.9 66.3 .......... 63.4 62.3 68.9 56.1 36.4 63.1 .......... 57.1June ............. 66.0 73.3 59.2 43.4 66.4 .......... 63.4 62.3 69.2 55.9 36.1 63.1 .......... 56.9July ............... 66.2 73.5 59.3 44.2 66.4 .......... 64.3 62.5 69.4 56.0 36.4 63.3 .......... 57.3Aug ............... 66.0 73.5 59.1 44.1 66.3 .......... 64.0 62.4 69.4 56.0 36.6 63.2 .......... 57.3Sept .............. 65.9 73.2 59.1 43.5 66.1 .......... 63.9 62.3 69.1 56.0 36.2 63.0 .......... 57.3Oct ............... 66.0 73.3 59.1 43.9 66.2 .......... 64.2 62.4 69.2 56.0 36.3 63.1 .......... 57.3Nov ............... 66.1 73.5 59.2 44.2 66.3 .......... 63.8 62.5 69.4 56.1 36.9 63.3 .......... 56.8Dec ............... 66.0 73.3 59.2 44.1 66.2 .......... 63.6 62.4 69.1 56.1 36.4 63.2 .......... 56.71Civilian labor force or civilian employment as percent <strong>of</strong> civilian noninstitutional population in group specified.2See footnote 1, Table B–37.Note.—Data relate to persons 16 years <strong>of</strong> age and over.See footnote 5 and Note, Table B-35.Source: Department <strong>of</strong> Labor, Bureau <strong>of</strong> Labor Statistics.257
- Page 1 and 2:
Economic Reportof the PresidentTran
- Page 3 and 4:
C O N T E N T SECONOMIC REPORT OF T
- Page 5 and 6:
ECONOMIC REPORT OF THE PRESIDENTTo
- Page 7 and 8:
the playing field is level for our
- Page 9 and 10:
LETTER OF TRANSMITTALCOUNCIL OF ECO
- Page 11 and 12:
Monetary Policy ...................
- Page 13 and 14:
Encouraging FDI ...................
- Page 15 and 16:
3-4. The Equivalence of Sales Taxes
- Page 17 and 18:
Real GDP expanded by 3.7 percent du
- Page 19 and 20:
Options for Tax ReformChapter 3, Op
- Page 21 and 22:
and better Nation for it. A compreh
- Page 23 and 24:
Innovation and the Information Econ
- Page 25 and 26:
ecause they do not expect family me
- Page 27 and 28:
The Administration has pushed aggre
- Page 29 and 30:
C H A P T E R 1The Year in Review a
- Page 31 and 32:
Consumer SpendingConsumer spending
- Page 33 and 34:
easons for this correlation are dis
- Page 35 and 36:
2003, a number of countries that to
- Page 37 and 38:
ProductivityRecent productivity gro
- Page 39 and 40:
The projected path of inflation as
- Page 41 and 42:
strengthen. The forecast is based o
- Page 43 and 44:
The growth rate of the economy over
- Page 45 and 46:
In sum, potential real GDP is proje
- Page 47 and 48:
C H A P T E R 2Expansions Past and
- Page 49 and 50:
The behavior of real GDP is similar
- Page 51 and 52:
of faltering may be attributable to
- Page 53 and 54:
most recent expansions have shown r
- Page 55 and 56:
middle of 2003. The more moderate r
- Page 57 and 58:
1.2 percent. Employment continued t
- Page 59 and 60:
SummaryModerate recessions are foll
- Page 61 and 62:
permanent cuts should permanently r
- Page 63 and 64:
and the Jobs and Growth Tax Relief
- Page 65 and 66:
Federal government revenues had bee
- Page 67 and 68:
Fiscal policy played an especially
- Page 69 and 70:
C H A P T E R 3Options for Tax Refo
- Page 71 and 72:
High Compliance CostsThe complexity
- Page 73 and 74:
a reasonable estimate is that a 10
- Page 75 and 76:
Excess BurdenBecause taxes distort
- Page 77 and 78:
Box 3-3 — continuedThe bottom 40
- Page 79 and 80:
more uniform or pure version of the
- Page 81 and 82:
of being collected all at once at t
- Page 83 and 84:
would have to differ from state tax
- Page 85 and 86:
owner claimed it was for business,
- Page 87 and 88:
The current set of saving incentive
- Page 89 and 90:
the current system. In addition, so
- Page 91 and 92:
C H A P T E R 4ImmigrationIn recent
- Page 93 and 94:
TABLE 4-1.— Foreign-Born Share of
- Page 95 and 96:
immigrants (also called illegal or
- Page 97 and 98:
largest group of immigrants was bor
- Page 99 and 100:
employment costs, including wage fl
- Page 101 and 102:
Chapter 4 | 103
- Page 103 and 104:
wages fall in response to immigrati
- Page 105 and 106:
immigrants from Latin America do re
- Page 107 and 108:
addition, as migrants leave the cou
- Page 109 and 110:
include siblings and adult children
- Page 111 and 112:
despite the tremendous growth in th
- Page 113 and 114:
The TWP would allow new foreign wor
- Page 115 and 116:
C H A P T E R 5Expanding Individual
- Page 117 and 118:
This phenomenon, known as the “tr
- Page 119 and 120:
producing more of that good. Simila
- Page 121 and 122:
In 2002, the President proposed “
- Page 123 and 124:
provide evidence of increased profi
- Page 125 and 126:
schools are four times as efficient
- Page 127 and 128:
low administrative costs, estimated
- Page 129 and 130:
Box 5-2: The Benefits of Land Title
- Page 131 and 132:
development plan designed by others
- Page 133 and 134:
C H A P T E R 6Innovation and theIn
- Page 135 and 136:
E-mail is the most common online ac
- Page 137 and 138:
Changed circumstances, such as new
- Page 139 and 140:
Illegal Acts on the InternetThe Int
- Page 141 and 142:
or develop new markets, which can l
- Page 143 and 144:
inflation factor for the price cap
- Page 145 and 146:
U.S. households connecting to local
- Page 147 and 148:
garbling their transmissions. To li
- Page 149 and 150:
from 51.3 percent in December 1999
- Page 151 and 152:
for their property rights. The Admi
- Page 153 and 154:
C H A P T E R 7The Global HIV/AIDS
- Page 155 and 156:
Chart 7-1 Estimated HIV Infection L
- Page 157 and 158:
There is no cure for HIV/AIDS, thou
- Page 159 and 160:
AIDS is more damaging to a househol
- Page 161 and 162:
and risk reduction have helped redu
- Page 163 and 164:
only one price, the drug companies
- Page 165 and 166:
Box 7-1 — continuedfocused on the
- Page 167 and 168:
Box 7-2 — continuedenhancing coor
- Page 169 and 170:
ConclusionThe United States and cou
- Page 171 and 172:
Good Two. In Ricardo’s simple mod
- Page 173 and 174:
The Impact of Trade on Labor Market
- Page 175 and 176:
The U.S. Advantage in Services Trad
- Page 177 and 178:
U.S. firms is associated with a cor
- Page 179 and 180:
anked the second-best country out o
- Page 181 and 182:
the Chinese government agreed to el
- Page 183 and 184:
Trade LiberalizationTariffs and oth
- Page 185 and 186:
ConclusionThe United States is the
- Page 187 and 188:
LETTER OF TRANSMITTALCOUNCIL OF ECO
- Page 189 and 190:
Report to the President on theActiv
- Page 191 and 192:
The Council continued its efforts t
- Page 193 and 194:
The Staff of the Council of Economi
- Page 195 and 196:
John List and Ted Gayer provided co
- Page 197:
Appendix BSTATISTICAL TABLES RELATI
- Page 200 and 201:
PageB-32. Gross saving and investme
- Page 202 and 203: PageB-94. Relation of profits after
- Page 204 and 205: NATIONAL INCOME OR EXPENDITURETABLE
- Page 206 and 207: TABLE B-2.—Real gross domestic pr
- Page 208 and 209: TABLE B-3.—Quantity and price ind
- Page 210 and 211: TABLE B-5.—Contributions to perce
- Page 212 and 213: TABLE B-6.—Chain-type quantity in
- Page 214 and 215: TABLE B-7.—Chain-type price index
- Page 216 and 217: TABLE B-8.—Gross domestic product
- Page 218 and 219: TABLE B-10.—Gross value added by
- Page 220 and 221: TABLE B-12.—Gross domestic produc
- Page 222 and 223: TABLE B-13.—Real gross domestic p
- Page 224 and 225: TABLE B-14.—Gross value added of
- Page 226 and 227: TABLE B-16.—Personal consumption
- Page 228 and 229: TABLE B-18.—Private fixed investm
- Page 230 and 231: TABLE B-20.—Government consumptio
- Page 232 and 233: TABLE B-22.—Private inventories a
- Page 234 and 235: TABLE B-24.—Foreign transactions
- Page 236 and 237: TABLE B-26.—Relation of gross dom
- Page 238 and 239: TABLE B-28.—National income by ty
- Page 240 and 241: TABLE B-29.—Sources of personal i
- Page 242 and 243: TABLE B-30.—Disposition of person
- Page 244 and 245: Year or quarterTABLE B-32.—Gross
- Page 246 and 247: TABLE B-33.—Median money income (
- Page 248 and 249: TABLE B-35.—Civilian population a
- Page 250 and 251: TABLE B-36.—Civilian employment a
- Page 254 and 255: TABLE B-40.—Civilian labor force
- Page 256 and 257: TABLE B-42.—Civilian unemployment
- Page 258 and 259: TABLE B-44.—Unemployment by durat
- Page 260 and 261: TABLE B-46.—Employees on nonagric
- Page 262 and 263: TABLE B-47.—Hours and earnings in
- Page 264 and 265: Year orquarterTABLE B-49.—Product
- Page 266 and 267: PRODUCTION AND BUSINESS ACTIVITYTAB
- Page 268 and 269: Year ormonthTABLE B-53.—Industria
- Page 270 and 271: Year or monthTABLE B-55.—New cons
- Page 272 and 273: TABLE B-57.—Manufacturing and tra
- Page 274 and 275: TABLE B-59.—Manufacturers’ new
- Page 276 and 277: Year ormonthTABLE B-61.—Consumer
- Page 278 and 279: TABLE B-62.—Consumer price indexe
- Page 280 and 281: TABLE B-64.—Changes in consumer p
- Page 282 and 283: TABLE B-65.—Producer price indexe
- Page 284 and 285: TABLE B-67.—Producer price indexe
- Page 286 and 287: TABLE B-68.—Changes in producer p
- Page 288 and 289: TABLE B-70.—Components of money s
- Page 290 and 291: TABLE B-71.—Aggregate reserves of
- Page 292 and 293: TABLE B-73.—Bond yields and inter
- Page 294 and 295: TABLE B-74.—Credit market borrowi
- Page 296 and 297: TABLE B-75.—Mortgage debt outstan
- Page 298 and 299: TABLE B-77.—Consumer credit outst
- Page 300 and 301: TABLE B-79.—Federal receipts, out
- Page 302 and 303:
TABLE B-81.—Federal receipts, out
- Page 304 and 305:
TABLE B-83.—Federal and State and
- Page 306 and 307:
TABLE B-85.—State and local gover
- Page 308 and 309:
End of yearor monthTABLE B-87.—U.
- Page 310 and 311:
End of monthTABLE B-89.—Estimated
- Page 312 and 313:
TABLE B-91.—Corporate profits by
- Page 314 and 315:
TABLE B-93.—Sales, profits, and s
- Page 316 and 317:
YearComposite(Dec. 31,2002=5,000) 3
- Page 318 and 319:
YearAGRICULTURETABLE B-97.—Farm i
- Page 320 and 321:
TABLE B-99.—Farm output and produ
- Page 322 and 323:
Year ormonthTABLE B-101.—Agricult
- Page 324 and 325:
INTERNATIONAL STATISTICSTABLE B-103
- Page 326 and 327:
TABLE B-104.—U.S. international t
- Page 328 and 329:
TABLE B-106.—U.S. international t
- Page 330 and 331:
TABLE B-108.—Industrial productio
- Page 332 and 333:
TABLE B-110.—Foreign exchange rat
- Page 334:
TABLE B-112.—Growth rates in real