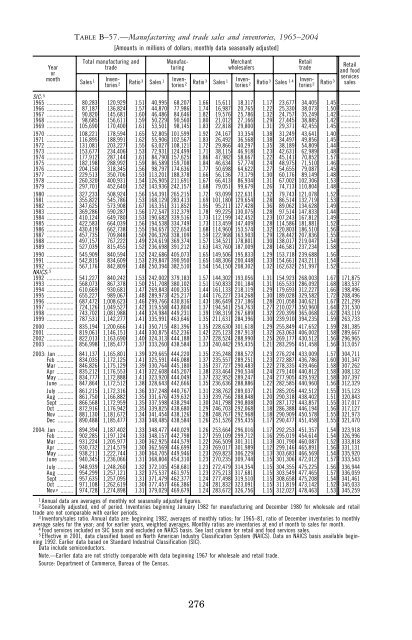
TABLE B–57.—Manufacturing and trade sales and inventories, 1965–2004[Amounts in millions <strong>of</strong> dollars; monthly data seasonally adjusted]YearormonthTotal manufacturing andtradeSales 1Inventories2Ratio 3 Sales 1ManufacturingInventories2Ratio 3 Sales 1MerchantwholesalersInventories2Ratio 3 Sales 14RetailtradeInventories2Ratio 3Retailand foodservicessalesSIC: 51965 ................... 80,283 120,929 1.51 40,995 68,207 1.66 15,611 18,317 1.17 23,677 34,405 1.45 ..............1966 ................... 87,187 136,824 1.57 44,870 77,986 1.74 16,987 20,765 1.22 25,330 38,073 1.50 ..............1967 ................... 90,820 145,681 1.60 46,486 84,646 1.82 19,576 25,786 1.32 24,757 35,249 1.42 ..............1968 ................... 98,685 156,611 1.59 50,229 90,560 1.80 21,012 27,166 1.29 27,445 38,885 1.42 ..............1969 ................... 105,690 170,400 1.61 53,501 98,145 1.83 22,818 29,800 1.31 29,371 42,455 1.45 ..............1970 ................... 108,221 178,594 1.65 52,805 101,599 1.92 24,167 33,354 1.38 31,249 43,641 1.40 ..............1971 ................... 116,895 188,991 1.62 55,906 102,567 1.83 26,492 36,568 1.38 34,497 49,856 1.45 ..............1972 ................... 131,081 203,227 1.55 63,027 108,121 1.72 29,866 40,297 1.35 38,189 54,809 1.44 ..............1973 ................... 153,677 234,406 1.53 72,931 124,499 1.71 38,115 46,918 1.23 42,631 62,989 1.48 ..............1974 ................... 177,912 287,144 1.61 84,790 157,625 1.86 47,982 58,667 1.22 45,141 70,852 1.57 ..............1975 ................... 182,198 288,992 1.59 86,589 159,708 1.84 46,634 57,774 1.24 48,975 71,510 1.46 ..............1976 ................... 204,150 318,345 1.56 98,797 174,636 1.77 50,698 64,622 1.27 54,655 79,087 1.45 ..............1977 ................... 229,513 350,706 1.53 113,201 188,378 1.66 56,136 73,179 1.30 60,176 89,149 1.48 ..............1978 ................... 260,320 400,931 1.54 126,905 211,691 1.67 66,413 86,934 1.31 67,002 102,306 1.53 ..............1979 ................... 297,701 452,640 1.52 143,936 242,157 1.68 79,051 99,679 1.26 74,713 110,804 1.48 ..............1980 ................... 327,233 508,924 1.56 154,391 265,215 1.72 93,099 122,631 1.32 79,743 121,078 1.52 ..............1981 ................... 355,822 545,786 1.53 168,129 283,413 1.69 101,180 129,654 1.28 86,514 132,719 1.53 ..............1982 ................... 347,625 573,908 1.67 163,351 311,852 1.95 95,211 127,428 1.36 89,062 134,628 1.49 ..............1983 ................... 369,286 590,287 1.56 172,547 312,379 1.78 99,225 130,075 1.28 97,514 147,833 1.44 ..............1984 ................... 410,124 649,780 1.53 190,682 339,516 1.73 112,199 142,452 1.23 107,243 167,812 1.49 ..............1985 ................... 422,583 664,039 1.56 194,538 334,749 1.73 113,459 147,409 1.28 114,586 181,881 1.52 ..............1986 ................... 430,419 662,738 1.55 194,657 322,654 1.68 114,960 153,574 1.32 120,803 186,510 1.56 ..............1987 ................... 457,735 709,848 1.50 206,326 338,109 1.59 122,968 163,903 1.29 128,442 207,836 1.55 ..............1988 ................... 497,157 767,222 1.49 224,619 369,374 1.57 134,521 178,801 1.30 138,017 219,047 1.54 ..............1989 ................... 527,039 815,455 1.52 236,698 391,212 1.63 143,760 187,009 1.28 146,581 237,234 1.58 ..............1990 ................... 545,909 840,594 1.52 242,686 405,073 1.65 149,506 195,833 1.29 153,718 239,688 1.56 ..............1991 ................... 542,815 834,609 1.53 239,847 390,950 1.65 148,306 200,448 1.33 154,661 243,211 1.54 ..............1992 ................... 567,176 842,809 1.48 250,394 382,510 1.54 154,150 208,302 1.32 162,632 251,997 1.52 ..............NAICS: 51992 ................... 541,227 840,242 1.53 242,002 379,183 1.57 144,302 193,056 1.31 154,923 268,003 1.67 171,8751993 ................... 568,073 867,378 1.50 251,708 380,102 1.51 150,833 201,184 1.31 165,533 286,092 1.68 183,5371994 ................... 610,669 930,681 1.47 269,843 400,335 1.44 161,133 218,119 1.29 179,693 312,227 1.66 198,4961995 ................... 655,227 989,067 1.48 289,973 425,217 1.44 176,227 234,268 1.30 189,028 329,582 1.72 208,4961996 ................... 687,472 1,008,623 1.46 299,766 430,816 1.43 186,649 237,186 1.28 201,058 340,621 1.67 221,2991997 ................... 724,126 1,049,527 1.42 319,558 443,804 1.37 194,541 254,763 1.27 210,027 350,960 1.64 231,5301998 ................... 743,702 1,081,988 1.44 324,984 449,231 1.39 198,319 267,689 1.32 220,399 365,068 1.62 243,1191999 ................... 787,531 1,142,277 1.41 335,991 463,646 1.35 211,631 284,396 1.30 239,910 394,235 1.59 263,7332000 ................... 835,194 1,200,666 1.41 350,715 481,396 1.35 228,630 301,618 1.29 255,849 417,652 1.59 281,3852001 ................... 819,061 1,146,151 1.44 330,875 452,236 1.42 225,123 287,913 1.32 263,063 406,002 1.58 289,6672002 ................... 822,013 1,163,690 1.40 324,313 444,188 1.37 228,524 288,990 1.25 269,177 430,512 1.56 296,9652003 ................... 856,998 1,185,477 1.37 333,260 438,584 1.33 240,442 295,435 1.21 283,295 451,458 1.56 313,0572003: Jan ........... 841,137 1,165,801 1.39 329,665 444,220 1.35 235,248 288,572 1.23 276,224 433,009 1.57 304,711Feb ............ 834,035 1,172,125 1.41 325,591 446,088 1.37 235,557 289,251 1.23 272,887 436,786 1.60 301,347Mar ........... 846,826 1,175,129 1.39 330,764 445,180 1.35 237,727 290,483 1.22 278,335 439,466 1.58 307,262Apr ............ 835,212 1,176,553 1.41 322,608 445,207 1.38 233,464 290,534 1.24 279,140 440,812 1.58 308,132May ........... 834,777 1,172,888 1.41 323,920 444,049 1.37 232,952 289,247 1.24 277,905 439,592 1.58 307,397June .......... 847,864 1,172,512 1.38 328,643 442,666 1.35 236,636 288,886 1.22 282,585 440,960 1.56 312,329July ........... 861,215 1,172,316 1.36 337,248 440,767 1.31 238,762 289,037 1.21 285,205 442,512 1.55 315,123Aug ........... 861,750 1,166,882 1.35 331,676 439,632 1.33 239,756 288,848 1.20 290,318 438,402 1.51 320,843Sept .......... 866,568 1,172,959 1.35 337,598 438,294 1.30 241,798 290,808 1.20 287,172 443,857 1.55 317,017Oct ............ 872,916 1,176,942 1.35 339,825 438,680 1.29 246,703 292,068 1.18 286,388 446,194 1.56 317,127Nov ........... 881,130 1,181,672 1.34 341,454 438,126 1.28 248,767 292,968 1.18 290,909 450,578 1.55 321,973Dec ........... 890,488 1,185,477 1.33 348,485 438,584 1.26 251,526 295,435 1.17 290,477 451,458 1.55 321,4702004: Jan ........... 894,394 1,187,402 1.33 348,477 440,029 1.26 253,664 296,016 1.17 292,253 451,357 1.54 323,918Feb ............ 902,285 1,197,124 1.33 348,157 442,798 1.27 259,109 299,712 1.16 295,019 454,614 1.54 326,996Mar ........... 931,224 1,205,977 1.30 362,925 444,579 1.22 266,509 301,311 1.13 301,790 460,087 1.52 333,818Apr ............ 930,732 1,214,579 1.30 362,569 446,699 1.23 269,017 301,989 1.12 299,146 465,891 1.56 331,131May ........... 938,211 1,222,744 1.30 364,705 449,946 1.23 269,823 306,229 1.13 303,683 466,569 1.54 335,920June .......... 940,345 1,236,066 1.31 368,804 454,310 1.23 270,235 309,744 1.15 301,306 472,012 1.57 333,543July ........... 948,939 1,248,260 1.32 372,105 458,681 1.23 272,479 314,354 1.15 304,355 475,225 1.56 336,944Aug ........... 954,299 1,257,121 1.32 375,537 461,975 1.23 275,213 317,681 1.15 303,549 477,465 1.57 336,059Sept .......... 957,635 1,257,095 1.31 371,479 462,377 1.24 277,498 319,510 1.15 308,658 475,208 1.54 341,461Oct ............ 971,108 1,262,619 1.30 377,457 466,386 1.24 281,832 323,091 1.15 311,819 473,142 1.52 345,033Nov p ......... 974,728 1,274,898 1.31 379,029 469,679 1.24 283,672 326,756 1.15 312,027 478,463 1.53 345,2591Annual data are averages <strong>of</strong> monthly not seasonally adjusted figures.2Seasonally adjusted, end <strong>of</strong> period. Inventories beginning January 1982 for manufacturing and December 1980 for wholesale and retailtrade are not comparable with earlier periods.3Inventory/sales ratio. Annual data are: beginning 1982, averages <strong>of</strong> monthly ratios; for 1965–81, ratio <strong>of</strong> December inventories to monthlyaverage sales for <strong>the</strong> year; and for earlier years, weighted averages. Monthly ratios are inventories at end <strong>of</strong> month to sales for month.4Food services included on SIC basis and excluded on NAICS basis. See last column for retail and food services sales.5Effective in 2001, data classified based on North American Industry Classification System (NAICS). Data on NAICS basis available beginning1992. Earlier data based on Standard Industrial Classification (SIC).Data include semiconductors.Note.—Earlier data are not strictly comparable with data beginning 1967 for wholesale and retail trade.Source: Department <strong>of</strong> Commerce, Bureau <strong>of</strong> <strong>the</strong> Census.276
TABLE B–58.—Manufacturers’ shipments and inventories, 1965–2004[Millions <strong>of</strong> dollars; monthly data seasonally adjusted]Shipments 1 Inventories 2Year or monthTotalDurablegoodsindustriesNondurablegoodsindustriesTotalTotalDurable goods industriesMaterialsandsuppliesWorkinprocessFinishedgoodsTotalNondurable goods industriesMaterialsandsuppliesWorkinprocessFinishedgoodsSIC: 31965 .................. 40,995 22,193 18,802 68,207 42,189 13,298 18,055 10,836 26,018 10,487 3,825 11,7061966 .................. 44,870 24,617 20,253 77,986 49,852 15,464 21,908 12,480 28,134 11,197 4,226 12,7111967 .................. 46,486 25,233 21,253 84,646 54,896 16,423 24,933 13,540 29,750 11,760 4,431 13,5591968 .................. 50,229 27,624 22,605 90,560 58,732 17,344 27,213 14,175 31,828 12,328 4,852 14,6481969 .................. 53,501 29,403 24,098 98,145 64,598 18,636 30,282 15,680 33,547 12,753 5,120 15,6741970 .................. 52,805 28,156 24,649 101,599 66,651 19,149 29,745 17,757 34,948 13,168 5,271 16,5091971 .................. 55,906 29,924 25,982 102,567 66,136 19,679 28,550 17,907 36,431 13,686 5,678 17,0671972 .................. 63,027 33,987 29,040 108,121 70,067 20,807 30,713 18,547 38,054 14,677 5,998 17,3791973 .................. 72,931 39,635 33,296 124,499 81,192 25,944 35,490 19,758 43,307 18,147 6,729 18,4311974 .................. 84,790 44,173 40,617 157,625 101,493 35,070 42,530 23,893 56,132 23,744 8,189 24,1991975 .................. 86,589 43,598 42,991 159,708 102,590 33,903 43,227 25,460 57,118 23,565 8,834 24,7191976 .................. 98,797 50,623 48,174 174,636 111,988 37,457 46,074 28,457 62,648 25,847 9,929 26,8721977 .................. 113,201 59,168 54,033 188,378 120,877 40,186 50,226 30,465 67,501 27,387 10,961 29,1531978 .................. 126,905 67,731 59,174 211,691 138,181 45,198 58,848 34,135 73,510 29,619 12,085 31,8061979 .................. 143,936 75,927 68,009 242,157 160,734 52,670 69,325 38,739 81,423 32,814 13,910 34,6991980 .................. 154,391 77,419 76,972 265,215 174,788 55,173 76,945 42,670 90,427 36,606 15,884 37,9371981 .................. 168,129 83,727 84,402 283,413 186,443 57,998 80,998 47,447 96,970 38,165 16,194 42,6111982 .................. 163,351 79,212 84,139 311,852 200,444 59,136 86,707 54,601 111,408 44,039 18,612 48,7571983 .................. 172,547 85,481 87,066 312,379 199,854 60,325 86,899 52,630 112,525 44,816 18,691 49,0181984 .................. 190,682 97,940 92,742 339,516 221,330 66,031 98,251 57,048 118,186 45,692 19,328 53,1661985 .................. 194,538 101,279 93,259 334,749 218,193 63,904 98,162 56,127 116,556 44,106 19,442 53,0081986 .................. 194,657 103,238 91,419 322,654 211,997 61,331 97,000 53,666 110,657 42,335 18,124 50,1981987 .................. 206,326 108,128 98,198 338,109 220,799 63,562 102,393 54,844 117,310 45,319 19,270 52,7211988 .................. 224,619 118,458 106,161 369,374 242,468 69,611 112,958 59,899 126,906 49,396 20,559 56,9511989 .................. 236,698 123,158 113,540 391,212 257,513 72,435 122,251 62,827 133,699 50,674 21,653 61,3721990 .................. 242,686 123,776 118,910 405,073 263,209 73,559 124,130 65,520 141,864 52,645 22,817 66,4021991 .................. 239,847 121,000 118,847 390,950 250,019 70,834 114,960 64,225 140,931 53,011 22,815 65,1051992 .................. 250,394 128,489 121,905 382,510 238,105 69,459 104,424 64,222 144,405 54,007 23,532 66,866NAICS: 31992 .................. 242,002 126,572 115,430 379,183 238,416 69,823 104,341 64,252 140,767 53,126 23,438 64,2031993 .................. 251,708 133,712 117,996 380,102 239,040 72,752 102,114 64,174 141,062 54,231 23,426 63,4051994 .................. 269,843 147,005 122,838 400,335 253,444 78,680 106,676 68,088 146,891 57,114 24,491 65,2861995 .................. 289,973 158,568 131,405 425,217 267,696 85,612 106,777 75,307 157,521 60,699 25,842 70,9801996 .................. 299,766 164,883 134,883 430,816 272,787 86,365 110,651 75,771 158,029 59,066 26,500 72,4631997 .................. 319,558 178,949 140,610 443,804 281,249 92,364 109,991 78,894 162,555 60,121 28,527 73,9071998 .................. 324,984 185,966 139,019 449,231 290,874 93,614 115,328 81,932 158,357 58,139 27,075 73,1431999 .................. 335,991 193,895 142,096 463,646 296,645 97,835 114,230 84,580 167,001 60,951 28,786 77,2642000 .................. 350,715 197,807 152,908 481,396 306,682 106,018 111,270 89,394 174,714 61,268 30,065 83,3812001 .................. 330,875 181,201 149,674 452,236 283,722 96,251 102,304 85,167 168,514 59,499 28,503 80,5122002 .................. 324,313 177,617 146,696 444,188 271,789 89,408 97,383 84,998 172,399 59,071 30,418 82,9102003 .................. 333,260 179,220 154,041 438,584 262,947 83,759 96,874 82,314 175,637 58,395 31,048 86,1942003: Jan ........... 329,665 177,331 152,334 444,220 270,964 88,916 97,287 84,761 173,256 60,248 30,606 82,402Feb .......... 325,591 173,992 151,599 446,088 270,765 88,703 97,432 84,630 175,323 60,758 30,994 83,571Mar .......... 330,764 175,475 155,289 445,180 269,454 87,948 97,009 84,497 175,726 60,258 31,422 84,046Apr .......... 322,608 173,512 149,096 445,207 269,285 87,443 97,851 83,991 175,922 60,741 30,859 84,322May ......... 323,920 173,783 150,137 444,049 268,449 87,129 97,810 83,510 175,600 60,539 30,596 84,465June ......... 328,643 176,782 151,861 442,666 266,154 86,243 96,243 83,668 176,512 59,786 31,166 85,560July .......... 337,248 181,761 155,487 440,767 264,638 85,203 96,383 83,052 176,129 58,920 31,502 85,707Aug .......... 331,676 177,187 154,489 439,632 262,949 84,068 96,258 82,623 176,683 59,117 31,452 86,114Sept ......... 337,598 182,379 155,219 438,294 261,678 83,637 95,533 82,508 176,616 59,396 31,293 85,927Oct .......... 339,825 183,740 156,085 438,680 262,351 84,013 96,225 82,113 176,329 59,121 31,655 85,553Nov ......... 341,454 184,074 157,380 438,126 261,414 83,523 95,973 81,918 176,712 59,096 31,952 85,664Dec ......... 348,485 187,978 160,507 438,584 262,947 83,759 96,874 82,314 175,637 58,395 31,048 86,1942004: Jan ........... 348,477 186,115 162,362 440,029 263,276 84,039 97,424 81,813 176,753 59,050 31,517 86,186Feb .......... 348,157 188,798 159,359 442,798 264,550 84,796 97,768 81,986 178,248 59,771 31,690 86,787Mar .......... 362,925 197,139 165,786 444,579 265,607 85,836 97,578 82,193 178,972 59,728 32,087 87,157Apr .......... 362,569 195,512 167,057 446,699 267,206 87,216 97,849 82,141 179,493 59,838 32,299 87,356May ......... 364,705 194,389 170,316 449,946 269,308 88,046 98,078 83,184 180,638 59,767 31,467 89,404June ......... 368,804 196,708 172,096 454,310 271,849 89,017 98,974 83,858 182,461 59,917 32,126 90,418July .......... 372,105 197,698 174,407 458,681 274,834 89,972 100,638 84,224 183,847 60,702 31,675 91,470Aug .......... 375,537 201,398 174,139 461,975 277,119 90,650 100,591 85,878 184,856 60,760 31,647 92,449Sept ......... 371,479 199,341 172,138 462,377 278,013 91,382 99,816 86,815 184,364 60,568 30,975 92,821Oct .......... 377,457 200,030 177,427 466,386 280,101 92,714 100,605 86,782 186,285 61,142 31,465 93,678Nov p ........ 379,029 199,799 179,230 469,679 282,291 93,555 101,757 86,979 187,388 61,131 31,519 94,7381Annual data are averages <strong>of</strong> monthly not seasonally adjusted figures.2Seasonally adjusted, end <strong>of</strong> period. Data beginning 1982 are not comparable with data for earlier data.3Effective in 2001, data classified based on North American Industry Classification System (NAICS). Data on NAICS basis available beginning1992. Earlier data based on Standard Industrial Classification (SIC).Data include semiconductors.Source: Department <strong>of</strong> Commerce, Bureau <strong>of</strong> <strong>the</strong> Census.277
- Page 1 and 2:
Economic Reportof the PresidentTran
- Page 3 and 4:
C O N T E N T SECONOMIC REPORT OF T
- Page 5 and 6:
ECONOMIC REPORT OF THE PRESIDENTTo
- Page 7 and 8:
the playing field is level for our
- Page 9 and 10:
LETTER OF TRANSMITTALCOUNCIL OF ECO
- Page 11 and 12:
Monetary Policy ...................
- Page 13 and 14:
Encouraging FDI ...................
- Page 15 and 16:
3-4. The Equivalence of Sales Taxes
- Page 17 and 18:
Real GDP expanded by 3.7 percent du
- Page 19 and 20:
Options for Tax ReformChapter 3, Op
- Page 21 and 22:
and better Nation for it. A compreh
- Page 23 and 24:
Innovation and the Information Econ
- Page 25 and 26:
ecause they do not expect family me
- Page 27 and 28:
The Administration has pushed aggre
- Page 29 and 30:
C H A P T E R 1The Year in Review a
- Page 31 and 32:
Consumer SpendingConsumer spending
- Page 33 and 34:
easons for this correlation are dis
- Page 35 and 36:
2003, a number of countries that to
- Page 37 and 38:
ProductivityRecent productivity gro
- Page 39 and 40:
The projected path of inflation as
- Page 41 and 42:
strengthen. The forecast is based o
- Page 43 and 44:
The growth rate of the economy over
- Page 45 and 46:
In sum, potential real GDP is proje
- Page 47 and 48:
C H A P T E R 2Expansions Past and
- Page 49 and 50:
The behavior of real GDP is similar
- Page 51 and 52:
of faltering may be attributable to
- Page 53 and 54:
most recent expansions have shown r
- Page 55 and 56:
middle of 2003. The more moderate r
- Page 57 and 58:
1.2 percent. Employment continued t
- Page 59 and 60:
SummaryModerate recessions are foll
- Page 61 and 62:
permanent cuts should permanently r
- Page 63 and 64:
and the Jobs and Growth Tax Relief
- Page 65 and 66:
Federal government revenues had bee
- Page 67 and 68:
Fiscal policy played an especially
- Page 69 and 70:
C H A P T E R 3Options for Tax Refo
- Page 71 and 72:
High Compliance CostsThe complexity
- Page 73 and 74:
a reasonable estimate is that a 10
- Page 75 and 76:
Excess BurdenBecause taxes distort
- Page 77 and 78:
Box 3-3 — continuedThe bottom 40
- Page 79 and 80:
more uniform or pure version of the
- Page 81 and 82:
of being collected all at once at t
- Page 83 and 84:
would have to differ from state tax
- Page 85 and 86:
owner claimed it was for business,
- Page 87 and 88:
The current set of saving incentive
- Page 89 and 90:
the current system. In addition, so
- Page 91 and 92:
C H A P T E R 4ImmigrationIn recent
- Page 93 and 94:
TABLE 4-1.— Foreign-Born Share of
- Page 95 and 96:
immigrants (also called illegal or
- Page 97 and 98:
largest group of immigrants was bor
- Page 99 and 100:
employment costs, including wage fl
- Page 101 and 102:
Chapter 4 | 103
- Page 103 and 104:
wages fall in response to immigrati
- Page 105 and 106:
immigrants from Latin America do re
- Page 107 and 108:
addition, as migrants leave the cou
- Page 109 and 110:
include siblings and adult children
- Page 111 and 112:
despite the tremendous growth in th
- Page 113 and 114:
The TWP would allow new foreign wor
- Page 115 and 116:
C H A P T E R 5Expanding Individual
- Page 117 and 118:
This phenomenon, known as the “tr
- Page 119 and 120:
producing more of that good. Simila
- Page 121 and 122:
In 2002, the President proposed “
- Page 123 and 124:
provide evidence of increased profi
- Page 125 and 126:
schools are four times as efficient
- Page 127 and 128:
low administrative costs, estimated
- Page 129 and 130:
Box 5-2: The Benefits of Land Title
- Page 131 and 132:
development plan designed by others
- Page 133 and 134:
C H A P T E R 6Innovation and theIn
- Page 135 and 136:
E-mail is the most common online ac
- Page 137 and 138:
Changed circumstances, such as new
- Page 139 and 140:
Illegal Acts on the InternetThe Int
- Page 141 and 142:
or develop new markets, which can l
- Page 143 and 144:
inflation factor for the price cap
- Page 145 and 146:
U.S. households connecting to local
- Page 147 and 148:
garbling their transmissions. To li
- Page 149 and 150:
from 51.3 percent in December 1999
- Page 151 and 152:
for their property rights. The Admi
- Page 153 and 154:
C H A P T E R 7The Global HIV/AIDS
- Page 155 and 156:
Chart 7-1 Estimated HIV Infection L
- Page 157 and 158:
There is no cure for HIV/AIDS, thou
- Page 159 and 160:
AIDS is more damaging to a househol
- Page 161 and 162:
and risk reduction have helped redu
- Page 163 and 164:
only one price, the drug companies
- Page 165 and 166:
Box 7-1 — continuedfocused on the
- Page 167 and 168:
Box 7-2 — continuedenhancing coor
- Page 169 and 170:
ConclusionThe United States and cou
- Page 171 and 172:
Good Two. In Ricardo’s simple mod
- Page 173 and 174:
The Impact of Trade on Labor Market
- Page 175 and 176:
The U.S. Advantage in Services Trad
- Page 177 and 178:
U.S. firms is associated with a cor
- Page 179 and 180:
anked the second-best country out o
- Page 181 and 182:
the Chinese government agreed to el
- Page 183 and 184:
Trade LiberalizationTariffs and oth
- Page 185 and 186:
ConclusionThe United States is the
- Page 187 and 188:
LETTER OF TRANSMITTALCOUNCIL OF ECO
- Page 189 and 190:
Report to the President on theActiv
- Page 191 and 192:
The Council continued its efforts t
- Page 193 and 194:
The Staff of the Council of Economi
- Page 195 and 196:
John List and Ted Gayer provided co
- Page 197:
Appendix BSTATISTICAL TABLES RELATI
- Page 200 and 201:
PageB-32. Gross saving and investme
- Page 202 and 203:
PageB-94. Relation of profits after
- Page 204 and 205:
NATIONAL INCOME OR EXPENDITURETABLE
- Page 206 and 207:
TABLE B-2.—Real gross domestic pr
- Page 208 and 209:
TABLE B-3.—Quantity and price ind
- Page 210 and 211:
TABLE B-5.—Contributions to perce
- Page 212 and 213:
TABLE B-6.—Chain-type quantity in
- Page 214 and 215:
TABLE B-7.—Chain-type price index
- Page 216 and 217:
TABLE B-8.—Gross domestic product
- Page 218 and 219:
TABLE B-10.—Gross value added by
- Page 220 and 221:
TABLE B-12.—Gross domestic produc
- Page 222 and 223: TABLE B-13.—Real gross domestic p
- Page 224 and 225: TABLE B-14.—Gross value added of
- Page 226 and 227: TABLE B-16.—Personal consumption
- Page 228 and 229: TABLE B-18.—Private fixed investm
- Page 230 and 231: TABLE B-20.—Government consumptio
- Page 232 and 233: TABLE B-22.—Private inventories a
- Page 234 and 235: TABLE B-24.—Foreign transactions
- Page 236 and 237: TABLE B-26.—Relation of gross dom
- Page 238 and 239: TABLE B-28.—National income by ty
- Page 240 and 241: TABLE B-29.—Sources of personal i
- Page 242 and 243: TABLE B-30.—Disposition of person
- Page 244 and 245: Year or quarterTABLE B-32.—Gross
- Page 246 and 247: TABLE B-33.—Median money income (
- Page 248 and 249: TABLE B-35.—Civilian population a
- Page 250 and 251: TABLE B-36.—Civilian employment a
- Page 252 and 253: TABLE B-38.—Unemployment by demog
- Page 254 and 255: TABLE B-40.—Civilian labor force
- Page 256 and 257: TABLE B-42.—Civilian unemployment
- Page 258 and 259: TABLE B-44.—Unemployment by durat
- Page 260 and 261: TABLE B-46.—Employees on nonagric
- Page 262 and 263: TABLE B-47.—Hours and earnings in
- Page 264 and 265: Year orquarterTABLE B-49.—Product
- Page 266 and 267: PRODUCTION AND BUSINESS ACTIVITYTAB
- Page 268 and 269: Year ormonthTABLE B-53.—Industria
- Page 270 and 271: Year or monthTABLE B-55.—New cons
- Page 274 and 275: TABLE B-59.—Manufacturers’ new
- Page 276 and 277: Year ormonthTABLE B-61.—Consumer
- Page 278 and 279: TABLE B-62.—Consumer price indexe
- Page 280 and 281: TABLE B-64.—Changes in consumer p
- Page 282 and 283: TABLE B-65.—Producer price indexe
- Page 284 and 285: TABLE B-67.—Producer price indexe
- Page 286 and 287: TABLE B-68.—Changes in producer p
- Page 288 and 289: TABLE B-70.—Components of money s
- Page 290 and 291: TABLE B-71.—Aggregate reserves of
- Page 292 and 293: TABLE B-73.—Bond yields and inter
- Page 294 and 295: TABLE B-74.—Credit market borrowi
- Page 296 and 297: TABLE B-75.—Mortgage debt outstan
- Page 298 and 299: TABLE B-77.—Consumer credit outst
- Page 300 and 301: TABLE B-79.—Federal receipts, out
- Page 302 and 303: TABLE B-81.—Federal receipts, out
- Page 304 and 305: TABLE B-83.—Federal and State and
- Page 306 and 307: TABLE B-85.—State and local gover
- Page 308 and 309: End of yearor monthTABLE B-87.—U.
- Page 310 and 311: End of monthTABLE B-89.—Estimated
- Page 312 and 313: TABLE B-91.—Corporate profits by
- Page 314 and 315: TABLE B-93.—Sales, profits, and s
- Page 316 and 317: YearComposite(Dec. 31,2002=5,000) 3
- Page 318 and 319: YearAGRICULTURETABLE B-97.—Farm i
- Page 320 and 321: TABLE B-99.—Farm output and produ
- Page 322 and 323:
Year ormonthTABLE B-101.—Agricult
- Page 324 and 325:
INTERNATIONAL STATISTICSTABLE B-103
- Page 326 and 327:
TABLE B-104.—U.S. international t
- Page 328 and 329:
TABLE B-106.—U.S. international t
- Page 330 and 331:
TABLE B-108.—Industrial productio
- Page 332 and 333:
TABLE B-110.—Foreign exchange rat
- Page 334:
TABLE B-112.—Growth rates in real