

Economic Report of the President
Economic Report of the President - 2005 - The American Presidency ...
Economic Report of the President - 2005 - The American Presidency ...

Create successful ePaper yourself
Turn your PDF publications into a flip-book with our unique Google optimized e-Paper software.
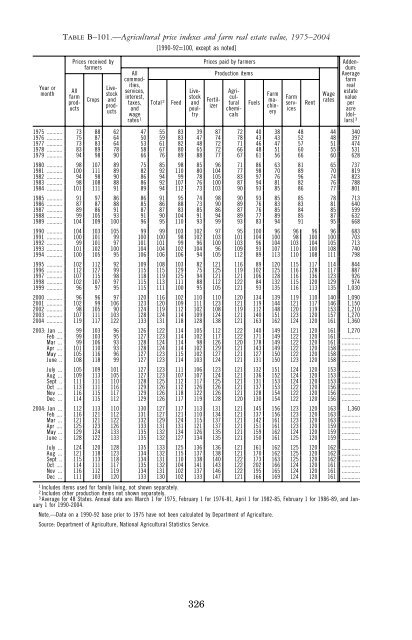
Year ormonthTABLE B–101.—Agricultural price indexes and farm real estate value, 1975–2004Prices received byfarmersAllfarmproductsCropsLivestockandproductsAllcommodities,services,interest,taxes,andwagerates 1[1990-92=100, except as noted]Total 2FeedLivestockandpoultryPrices paid by farmersFertilizerProduction itemsAgriculturalchemicalsFuelsFarmmachineryFarmservicesRentWageratesAddendum:Averagefarmrealestatevalueperacre(dollars)31975 ........... 73 88 62 47 55 83 39 87 72 40 38 48 44 3401976 ........... 75 87 64 50 59 83 47 74 78 43 43 52 48 3971977 ........... 73 83 64 53 61 82 48 72 71 46 47 57 51 4741978 ........... 83 89 78 58 67 80 65 72 66 48 51 60 55 5311979 ........... 94 98 90 66 76 89 88 77 67 61 56 66 60 6281980 ........... 98 107 89 75 85 98 85 96 71 86 63 81 65 7371981 ........... 100 111 89 82 92 110 80 104 77 98 70 89 70 8191982 ........... 94 98 90 86 94 99 78 105 83 97 76 96 74 8231983 ........... 98 108 88 86 92 107 76 100 87 94 81 82 76 7881984 ........... 101 111 91 89 94 112 73 103 90 93 85 86 77 8011985 ........... 91 97 86 86 91 95 74 98 90 93 85 85 78 7131986 ........... 87 87 88 85 86 88 73 90 89 76 83 83 81 6401987 ........... 89 86 91 87 87 83 85 86 87 76 85 84 85 5991988 ........... 99 105 93 91 90 104 91 94 89 77 89 85 87 6321989 ........... 104 109 100 96 95 110 93 99 93 83 94 91 95 6681990 ........... 104 103 105 99 99 103 102 97 95 100 96 96 96 96 6831991 ........... 100 101 99 100 100 98 102 103 101 104 100 98 100 100 7031992 ........... 99 101 97 101 101 99 96 100 103 96 104 103 104 105 7131993 ........... 101 102 100 104 104 102 104 96 109 93 107 110 100 108 7401994 ........... 100 105 95 106 106 106 94 105 112 89 113 110 108 111 7981995 ........... 102 112 92 109 108 103 82 121 116 89 120 115 117 114 8441996 ........... 112 127 99 115 115 129 75 125 119 102 125 116 128 117 8871997 ........... 107 115 98 118 119 125 94 121 121 106 128 116 136 123 9261998 ........... 102 107 97 115 113 111 88 112 122 84 132 115 120 129 9741999 ........... 96 97 95 115 111 100 95 105 121 93 135 116 113 135 1,0302000 ........... 96 96 97 120 116 102 110 110 120 134 139 119 110 140 1,0902001 ........... 102 99 106 123 120 109 111 123 121 119 144 121 117 146 1,1502002 ........... 98 105 90 124 119 112 102 108 119 112 148 120 119 153 1,2102003 ........... 107 111 103 128 124 114 109 124 121 140 151 123 120 157 1,2702004 ........... 119 117 122 133 131 118 128 138 121 163 162 124 120 161 1,3602003: Jan ... 99 103 96 126 122 114 105 112 122 140 149 121 120 161 1,270Feb .... 99 103 95 127 123 114 102 117 122 171 149 122 120 161 .............Mar ... 99 106 93 128 124 114 98 126 120 178 149 122 120 161 .............Apr .... 101 110 93 128 124 114 102 129 121 143 149 122 120 158 .............May ... 105 116 96 127 123 115 102 127 121 127 150 122 120 158 .............June .. 108 118 99 127 123 114 103 124 121 131 150 123 120 158 .............July ... 105 109 101 127 123 111 106 123 121 132 151 124 120 153 .............Aug ... 109 113 105 127 123 107 107 124 121 136 152 124 120 153 .............Sept .. 111 111 110 128 125 112 117 125 121 131 153 124 120 153 .............Oct .... 113 111 116 129 126 112 126 126 121 137 153 122 120 156 .............Nov ... 116 115 117 129 126 118 122 126 121 128 154 122 120 156 .............Dec ... 114 115 112 129 126 117 119 128 120 130 154 122 120 156 .............2004: Jan ... 112 113 110 130 127 117 113 131 121 145 156 123 120 163 1,360Feb .... 116 121 112 131 127 121 110 134 121 137 156 123 120 163 .............Mar ... 121 121 122 132 129 124 115 137 121 142 161 123 120 163 .............Apr .... 125 123 126 133 131 131 121 137 121 151 161 123 120 159 .............May ... 129 124 133 135 132 134 126 135 121 159 162 124 120 159 .............June .. 128 122 133 135 132 127 134 135 121 150 161 125 120 159 .............July ... 124 120 128 135 133 125 136 136 121 161 162 125 120 162 .............Aug ... 121 118 123 134 132 115 137 138 121 170 162 125 120 162 .............Sept .. 115 113 118 134 131 110 138 140 122 173 163 125 120 162 .............Oct .... 114 111 117 135 132 104 141 143 122 202 166 124 120 161 .............Nov ... 116 112 119 134 131 102 137 146 122 195 165 124 120 161 .............Dec ... 111 103 120 133 130 102 133 147 121 166 169 124 120 161 .............1Includes items used for family living, not shown separately.2Includes o<strong>the</strong>r production items not shown separately.3Average for 48 States. Annual data are: March 1 for 1975, February 1 for 1976-81, April 1 for 1982-85, February 1 for 1986-89, and January1 for 1990-2004.Note.—Data on a 1990-92 base prior to 1975 have not been calculated by Department <strong>of</strong> Agriculture.Source: Department <strong>of</strong> Agriculture, National Agricultural Statistics Service.326


