

hus14
hus14
hus14

Create successful ePaper yourself
Turn your PDF publications into a flip-book with our unique Google optimized e-Paper software.
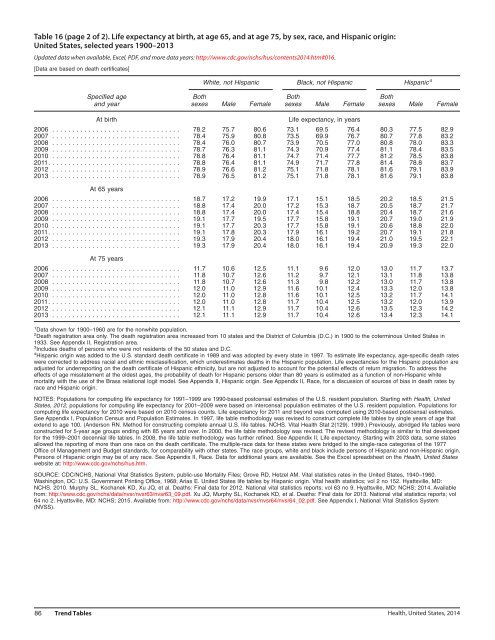
Table 16 (page 2 of 2). Life expectancy at birth, at age 65, and at age 75, by sex, race, and Hispanic origin:<br />
United States, selected years 1900–2013<br />
Updated data when available, Excel, PDF, and more data years: http://www.cdc.gov/nchs/hus/contents2014.htm#016.<br />
[Data are based on death certificates]<br />
White, not Hispanic Black, not Hispanic Hispanic 4<br />
Specified age Both Both Both<br />
and year sexes Male Female sexes Male Female sexes Male Female<br />
At birth<br />
Life expectancy, in years<br />
2006 ................................ 78.2 75.7 80.6 73.1 69.5 76.4 80.3 77.5 82.9<br />
2007 ................................ 78.4 75.9 80.8 73.5 69.9 76.7 80.7 77.8 83.2<br />
2008 ................................ 78.4 76.0 80.7 73.9 70.5 77.0 80.8 78.0 83.3<br />
2009 ................................ 78.7 76.3 81.1 74.3 70.9 77.4 81.1 78.4 83.5<br />
2010 ................................ 78.8 76.4 81.1 74.7 71.4 77.7 81.2 78.5 83.8<br />
2011................................. 78.8 76.4 81.1 74.9 71.7 77.8 81.4 78.8 83.7<br />
2012 ................................ 78.9 76.6 81.2 75.1 71.8 78.1 81.6 79.1 83.9<br />
2013 ................................ 78.9 76.5 81.2 75.1 71.8 78.1 81.6 79.1 83.8<br />
At 65 years<br />
2006 ................................ 18.7 17.2 19.9 17.1 15.1 18.5 20.2 18.5 21.5<br />
2007 ................................ 18.8 17.4 20.0 17.2 15.3 18.7 20.5 18.7 21.7<br />
2008 ................................ 18.8 17.4 20.0 17.4 15.4 18.8 20.4 18.7 21.6<br />
2009 ................................ 19.1 17.7 19.5 17.7 15.8 19.1 20.7 19.0 21.9<br />
2010 ................................ 19.1 17.7 20.3 17.7 15.8 19.1 20.6 18.8 22.0<br />
2011................................. 19.1 17.8 20.3 17.9 16.1 19.2 20.7 19.1 21.8<br />
2012 ................................ 19.3 17.9 20.4 18.0 16.1 19.4 21.0 19.5 22.1<br />
2013 ................................ 19.3 17.9 20.4 18.0 16.1 19.4 20.9 19.3 22.0<br />
At 75 years<br />
2006 ................................ 11.7 10.6 12.5 11.1 9.6 12.0 13.0 11.7 13.7<br />
2007 ................................ 11.8 10.7 12.6 11.2 9.7 12.1 13.1 11.8 13.8<br />
2008 ................................ 11.8 10.7 12.6 11.3 9.8 12.2 13.0 11.7 13.8<br />
2009 ................................ 12.0 11.0 12.9 11.6 10.1 12.4 13.3 12.0 13.8<br />
2010 ................................ 12.0 11.0 12.8 11.6 10.1 12.5 13.2 11.7 14.1<br />
2011................................. 12.0 11.0 12.8 11.7 10.4 12.5 13.2 12.0 13.9<br />
2012 ................................ 12.1 11.1 12.9 11.7 10.4 12.6 13.5 12.3 14.2<br />
2013 ................................ 12.1 11.1 12.9 11.7 10.4 12.6 13.4 12.3 14.1<br />
1 Data shown for 1900–1960 are for the nonwhite population.<br />
2 Death registration area only. The death registration area increased from 10 states and the District of Columbia (D.C.) in 1900 to the coterminous United States in<br />
1933. See Appendix II, Registration area.<br />
3 Includes deaths of persons who were not residents of the 50 states and D.C.<br />
4 Hispanic origin was added to the U.S. standard death certificate in 1989 and was adopted by every state in 1997. To estimate life expectancy, age-specific death rates<br />
were corrected to address racial and ethnic misclassification, which underestimates deaths in the Hispanic population. Life expectancies for the Hispanic population are<br />
adjusted for underreporting on the death certificate of Hispanic ethnicity, but are not adjusted to account for the potential effects of return migration. To address the<br />
effects of age misstatement at the oldest ages, the probability of death for Hispanic persons older than 80 years is estimated as a function of non-Hispanic white<br />
mortality with the use of the Brass relational logit model. See Appendix II, Hispanic origin. See Appendix II, Race, for a discussion of sources of bias in death rates by<br />
race and Hispanic origin.<br />
NOTES: Populations for computing life expectancy for 1991–1999 are 1990-based postcensal estimates of the U.S. resident population. Starting with Health, United<br />
States, 2012, populations for computing life expectancy for 2001–2009 were based on intercensal population estimates of the U.S. resident population. Populations for<br />
computing life expectancy for 2010 were based on 2010 census counts. Life expectancy for 2011 and beyond was computed using 2010-based postcensal estimates.<br />
See Appendix I, Population Census and Population Estimates. In 1997, life table methodology was revised to construct complete life tables by single years of age that<br />
extend to age 100. (Anderson RN. Method for constructing complete annual U.S. life tables. NCHS. Vital Health Stat 2(129). 1999.) Previously, abridged life tables were<br />
constructed for 5-year age groups ending with 85 years and over. In 2000, the life table methodology was revised. The revised methodology is similar to that developed<br />
for the 1999–2001 decennial life tables. In 2008, the life table methodology was further refined. See Appendix II, Life expectancy. Starting with 2003 data, some states<br />
allowed the reporting of more than one race on the death certificate. The multiple-race data for these states were bridged to the single-race categories of the 1977<br />
Office of Management and Budget standards, for comparability with other states. The race groups, white and black include persons of Hispanic and non-Hispanic origin.<br />
Persons of Hispanic origin may be of any race. See Appendix II, Race. Data for additional years are available. See the Excel spreadsheet on the Health, United States<br />
website at: http://www.cdc.gov/nchs/hus.htm.<br />
SOURCE: CDC/NCHS, National Vital Statistics System, public-use Mortality Files; Grove RD, Hetzel AM. Vital statistics rates in the United States, 1940–1960.<br />
Washington, DC: U.S. Government Printing Office, 1968; Arias E. United States life tables by Hispanic origin. Vital health statistics; vol 2 no 152. Hyattsville, MD:<br />
NCHS. 2010. Murphy SL, Kochanek KD, Xu JQ, et al. Deaths: Final data for 2012. National vital statistics reports; vol 63 no 9. Hyattsville, MD: NCHS; 2014. Available<br />
from: http://www.cdc.gov/nchs/data/nvsr/nvsr63/nvsr63_09.pdf. Xu JQ, Murphy SL, Kochanek KD, et al. Deaths: Final data for 2013. National vital statistics reports; vol<br />
64 no 2. Hyattsville, MD: NCHS; 2015. Available from: http://www.cdc.gov/nchs/data/nvsr/nvsr64/nvsr64_02.pdf. See Appendix I, National Vital Statistics System<br />
(NVSS).<br />
86 Trend Tables Health, United States, 2014