

hus14
hus14
hus14

Create successful ePaper yourself
Turn your PDF publications into a flip-book with our unique Google optimized e-Paper software.
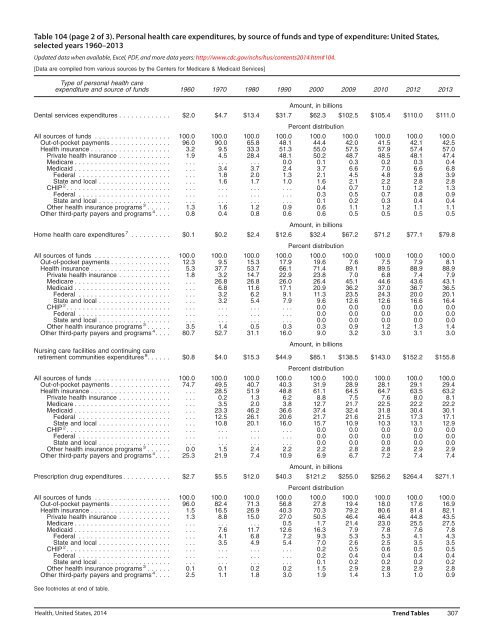
Table 104 (page 2 of 3). Personal health care expenditures, by source of funds and type of expenditure: United States,<br />
selected years 1960–2013<br />
Updated data when available, Excel, PDF, and more data years: http://www.cdc.gov/nchs/hus/contents2014.htm#104.<br />
[Data are compiled from various sources by the Centers for Medicare & Medicaid Services]<br />
Type of personal health care<br />
expenditure and source of funds 1960 1970 1980 1990 2000 2009 2010 2012 2013<br />
Amount, in billions<br />
Dental services expenditures . ............ $2.0 $4.7 $13.4 $31.7 $62.3 $102.5 $105.4 $110.0 $111.0<br />
Percent distribution<br />
All sources of funds ................... 100.0 100.0 100.0 100.0 100.0 100.0 100.0 100.0 100.0<br />
Out-of-pocket payments ............... 96.0 90.0 65.8 48.1 44.4 42.0 41.5 42.1 42.5<br />
Health insurance .................... 3.2 9.5 33.3 51.3 55.0 57.5 57.9 57.4 57.0<br />
Private health insurance ............. 1.9 4.5 28.4 48.1 50.2 48.7 48.5 48.1 47.4<br />
Medicare ........................ ... ... ... 0.0 0.1 0.3 0.2 0.3 0.4<br />
Medicaid ........................ ... 3.4 3.7 2.4 3.7 6.6 7.0 6.6 6.8<br />
Federal ....................... ... 1.8 2.0 1.3 2.1 4.5 4.8 3.8 3.9<br />
State and local .................. ... 1.6 1.7 1.0 1.6 2.1 2.2 2.8 2.8<br />
CHIP 2 .......................... ... ... ... ... 0.4 0.7 1.0 1.2 1.3<br />
Federal ....................... ... ... ... ... 0.3 0.5 0.7 0.8 0.9<br />
State and local .................. ... ... ... ... 0.1 0.2 0.3 0.4 0.4<br />
Other health insurance programs 3 ......<br />
Other third-party payers and programs 4 ....<br />
1.3<br />
0.8<br />
1.6<br />
0.4<br />
Amount, in billions<br />
Home health care expenditures 7 .......... $0.1 $0.2 $2.4 $12.6 $32.4 $67.2 $71.2 $77.1 $79.8<br />
Percent distribution<br />
All sources of funds ................... 100.0 100.0 100.0 100.0 100.0 100.0 100.0 100.0 100.0<br />
Out-of-pocket payments ............... 12.3 9.5 15.3 17.9 19.6 7.6 7.5 7.9 8.1<br />
Health insurance .................... 5.3 37.7 53.7 66.1 71.4 89.1 89.5 88.9 88.9<br />
Private health insurance ............. 1.8 3.2 14.7 22.9 23.8 7.0 6.8 7.4 7.9<br />
Medicare ........................ ... 26.8 26.8 26.0 26.4 45.1 44.6 43.6 43.1<br />
Medicaid ........................ ... 6.8 11.6 17.1 20.9 36.2 37.0 36.7 36.5<br />
Federal ....................... ... 3.2 6.2 9.1 11.3 23.5 24.3 20.0 20.1<br />
State and local .................. ... 3.2 5.4 7.9 9.6 12.6 12.6 16.6 16.4<br />
CHIP 2 .......................... ... ... ... ... 0.0 0.0 0.0 0.0 0.0<br />
Federal ....................... ... ... ... ... 0.0 0.0 0.0 0.0 0.0<br />
State and local .................. ... ... ... ... 0.0 0.0 0.0 0.0 0.0<br />
Other health insurance programs 3 ......<br />
Other third-party payers and programs 4 ....<br />
3.5<br />
80.7<br />
1.4<br />
52.7<br />
0.5<br />
31.1<br />
0.3<br />
16.0<br />
0.3<br />
9.0<br />
0.9<br />
3.2<br />
1.2<br />
3.0<br />
1.3<br />
3.1<br />
1.4<br />
3.0<br />
Amount, in billions<br />
Nursing care facilities and continuing care<br />
retirement communities expenditures 8 ...... $0.8 $4.0 $15.3 $44.9 $85.1 $138.5 $143.0 $152.2 $155.8<br />
Percent distribution<br />
All sources of funds ................... 100.0 100.0 100.0 100.0 100.0 100.0 100.0 100.0 100.0<br />
Out-of-pocket payments ............... 74.7 49.5 40.7 40.3 31.9 28.9 28.1 29.1 29.4<br />
Health insurance .................... ... 28.5 51.9 48.8 61.1 64.5 64.7 63.5 63.2<br />
Private health insurance ............. ... 0.2 1.3 6.2 8.8 7.5 7.6 8.0 8.1<br />
Medicare ........................ ... 3.5 2.0 3.8 12.7 21.7 22.5 22.2 22.2<br />
Medicaid ........................ ... 23.3 46.2 36.6 37.4 32.4 31.8 30.4 30.1<br />
Federal ....................... ... 12.5 26.1 20.6 21.7 21.6 21.5 17.3 17.1<br />
State and local .................. ... 10.8 20.1 16.0 15.7 10.9 10.3 13.1 12.9<br />
CHIP 2 .......................... ... ... ... ... 0.0 0.0 0.0 0.0 0.0<br />
Federal ....................... ... ... ... ... 0.0 0.0 0.0 0.0 0.0<br />
State and local .................. ... ... ... ... 0.0 0.0 0.0 0.0 0.0<br />
Other health insurance programs 3 ......<br />
Other third-party payers and programs 4 ....<br />
0.0<br />
25.3<br />
1.5<br />
21.9<br />
2.4<br />
7.4<br />
2.2<br />
10.9<br />
2.2<br />
6.9<br />
2.8<br />
6.7<br />
2.8<br />
7.2<br />
2.9<br />
7.4<br />
2.9<br />
7.4<br />
Amount, in billions<br />
Prescription drug expenditures ............ $2.7 $5.5 $12.0 $40.3 $121.2 $255.0 $256.2 $264.4 $271.1<br />
Percent distribution<br />
All sources of funds ................... 100.0 100.0 100.0 100.0 100.0 100.0 100.0 100.0 100.0<br />
Out-of-pocket payments ............... 96.0 82.4 71.3 56.8 27.8 19.4 18.0 17.6 16.9<br />
Health insurance .................... 1.5 16.5 26.9 40.3 70.3 79.2 80.6 81.4 82.1<br />
Private health insurance ............. 1.3 8.8 15.0 27.0 50.5 46.4 46.4 44.8 43.5<br />
Medicare ........................ ... ... ... 0.5 1.7 21.4 23.0 25.5 27.5<br />
Medicaid ........................ ... 7.6 11.7 12.6 16.3 7.9 7.8 7.6 7.8<br />
Federal ....................... ... 4.1 6.8 7.2 9.3 5.3 5.3 4.1 4.3<br />
State and local .................. ... 3.5 4.9 5.4 7.0 2.6 2.5 3.5 3.5<br />
CHIP 2 .......................... ... ... ... ... 0.2 0.5 0.6 0.5 0.5<br />
Federal ....................... ... ... ... ... 0.2 0.4 0.4 0.4 0.4<br />
State and local .................. ... ... ... ... 0.1 0.2 0.2 0.2 0.2<br />
Other health insurance programs 3 ......<br />
Other third-party payers and programs 4 ....<br />
0.1<br />
2.5<br />
0.1<br />
1.1<br />
0.2<br />
1.8<br />
0.2<br />
3.0<br />
1.5<br />
1.9<br />
2.9<br />
1.4<br />
2.8<br />
1.3<br />
2.9<br />
1.0<br />
2.8<br />
0.9<br />
See footnotes at end of table.<br />
1.2<br />
0.8<br />
0.9<br />
0.6<br />
0.6<br />
0.6<br />
1.1<br />
0.5<br />
1.2<br />
0.5<br />
1.1<br />
0.5<br />
1.1<br />
0.5<br />
Health, United States, 2014<br />
Trend Tables 307