Table 24 (page 1 of 3). Death rates for diseases of heart, by sex, race, Hispanic origin, and age: United States, selected years 1950–2013 Updated data when available, Excel, PDF, and more data years: http://www.cdc.gov/nchs/hus/contents2014.htm#024. [Data are based on death certificates] Sex, race, Hispanic origin, and age 1950 1,2 1960 1,2 1970 2 1980 2 1990 2 2000 3 2012 3 2013 3 All persons Deaths per 100,000 resident population All ages, age-adjusted 4 ....... 588.8 559.0 492.7 412.1 321.8 257.6 170.5 169.8 All ages, crude ............. 356.8 369.0 362.0 336.0 289.5 252.6 191.0 193.3 Under 1 year. .............. 4.1 6.6 13.1 22.8 20.1 13.0 8.5 7.8 1–4 years ................. 1.6 1.3 1.7 2.6 1.9 1.2 1.0 1.1 5–14 years ................ 3.9 1.3 0.8 0.9 0.9 0.7 0.4 0.4 15–24 years ............... 8.2 4.0 3.0 2.9 2.5 2.6 2.2 2.1 25–34 years ............... 20.9 15.6 11.4 8.3 7.6 7.4 7.6 7.6 35–44 years ............... 88.3 74.6 66.7 44.6 31.4 29.2 25.9 25.6 45–54 years ............... 309.2 271.8 238.4 180.2 120.5 94.2 79.7 80.3 55–64 years ............... 804.3 737.9 652.3 494.1 367.3 261.2 184.6 184.6 65–74 years ............... 1,857.2 1,740.5 1,558.2 1,218.6 894.3 665.6 388.3 390.3 75–84 years ............... 4,311.0 4,089.4 3,683.8 2,993.1 2,295.7 1,780.3 1,103.7 1,095.1 85 years and over ........... 9,152.5 9,317.8 7,891.3 7,777.1 6,739.9 5,926.1 4,046.1 4,013.9 Male All ages, age-adjusted 4 ....... 699.0 687.6 634.0 538.9 412.4 320.0 214.7 214.5 All ages, crude ............. 424.7 439.5 422.5 368.6 297.6 249.8 202.3 206.5 Under 1 year. .............. 4.7 7.8 15.1 25.5 21.9 13.3 9.6 8.7 1–4 years ................. 1.7 1.4 1.9 2.8 1.9 1.4 1.0 1.2 5–14 years ................ 3.5 1.4 0.9 1.0 0.9 0.8 0.5 0.4 15–24 years ............... 8.3 4.2 3.7 3.7 3.1 3.2 2.9 2.8 25–34 years ............... 24.4 20.1 15.2 11.4 10.3 9.6 10.4 10.2 35–44 years ............... 120.4 112.7 103.2 68.7 48.1 41.4 35.8 35.5 45–54 years ............... 441.2 420.4 376.4 282.6 183.0 140.2 114.3 115.1 55–64 years ............... 1,100.5 1,066.9 987.2 746.8 537.3 371.7 266.4 267.3 65–74 years ............... 2,310.2 2,291.3 2,170.3 1,728.0 1,250.0 898.3 527.7 530.9 75–84 years ............... 4,825.8 4,742.4 4,534.8 3,834.3 2,968.2 2,248.1 1,388.1 1,382.4 85 years and over ........... 9,661.4 9,788.9 8,426.2 8,752.7 7,418.4 6,430.0 4,582.7 4,564.2 Female All ages, age-adjusted 4 ....... 486.6 447.0 381.6 320.8 257.0 210.9 135.5 134.3 All ages, crude ............. 289.7 300.6 304.5 305.1 281.8 255.3 180.2 180.6 Under 1 year. .............. 3.4 5.4 10.9 20.0 18.3 12.5 7.3 6.9 1–4 years ................. 1.6 1.1 1.6 2.5 1.9 1.0 0.9 0.9 5–14 years ................ 4.3 1.2 0.8 0.9 0.8 0.5 0.4 0.4 15–24 years ............... 8.2 3.7 2.3 2.1 1.8 2.1 1.5 1.5 25–34 years ............... 17.6 11.3 7.7 5.3 5.0 5.2 4.8 4.9 35–44 years ............... 57.0 38.2 32.2 21.4 15.1 17.2 16.0 15.7 45–54 years ............... 177.8 127.5 109.9 84.5 61.0 49.8 46.0 46.6 55–64 years ............... 507.0 429.4 351.6 272.1 215.7 159.3 108.4 107.5 65–74 years ............... 1,434.9 1,261.3 1,082.7 828.6 616.8 474.0 266.2 266.8 75–84 years ............... 3,873.0 3,582.7 3,120.8 2,497.0 1,893.8 1,475.1 893.0 879.8 85 years and over ........... 8,798.1 9,016.8 7,591.8 7,350.5 6,478.1 5,720.9 3,777.5 3,732.9 White male 5 All ages, age-adjusted 4 ....... 701.4 694.5 640.2 539.6 409.2 316.7 213.1 213.1 All ages, crude ............. 434.2 454.6 438.3 384.0 312.7 265.8 218.0 222.6 45–54 years ............... 424.1 413.2 365.7 269.8 170.6 130.7 108.3 109.8 55–64 years ............... 1,082.6 1,056.0 979.3 730.6 516.7 351.8 253.2 254.0 65–74 years ............... 2,309.4 2,297.9 2,177.2 1,729.7 1,230.5 877.8 513.5 516.0 75–84 years ............... 4,908.0 4,839.9 4,617.6 3,883.2 2,983.4 2,247.0 1,392.6 1,389.0 85 years and over ........... 9,952.3 10,135.8 8,818.0 8,958.0 7,558.7 6,560.8 4,712.4 4,701.6 Black or African American male 5 All ages, age-adjusted 4 ....... 641.5 615.2 607.3 561.4 485.4 392.5 265.3 262.8 All ages, crude ............. 348.4 330.6 330.3 301.0 256.8 211.1 174.7 177.2 45–54 years ............... 624.1 514.0 512.8 433.4 328.9 247.2 182.4 178.3 55–64 years ............... 1,434.0 1,236.8 1,135.4 987.2 824.0 631.2 435.9 430.0 65–74 years ............... 75–84 years 6 .............. 2,140.1 4,107.9 2,281.4 3,533.6 2,237.8 3,783.4 1,847.2 3,578.8 1,632.9 3,107.1 1,268.8 2,597.6 805.5 1,677.7 807.5 1,660.0 85 years and over ........... -- 6,037.9 5,367.6 6,819.5 6,479.6 5,633.5 3,822.1 3,754.5 See footnotes at end of table. 110 Trend Tables Health, United States, 2014
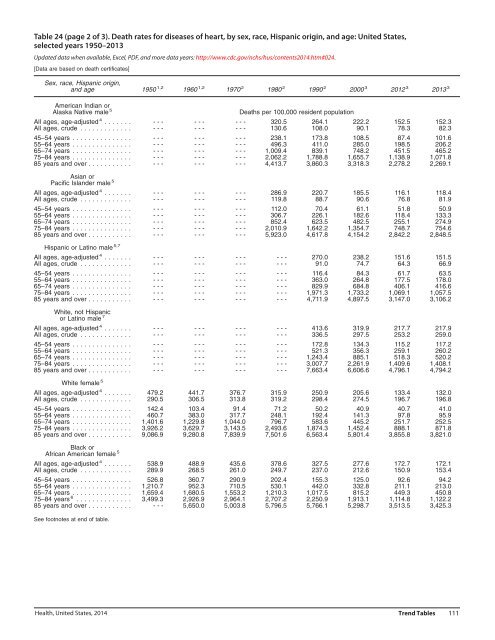
Table 24 (page 2 of 3). Death rates for diseases of heart, by sex, race, Hispanic origin, and age: United States, selected years 1950–2013 Updated data when available, Excel, PDF, and more data years: http://www.cdc.gov/nchs/hus/contents2014.htm#024. [Data are based on death certificates] Sex, race, Hispanic origin, and age 1950 1,2 1960 1,2 1970 2 1980 2 1990 2 2000 3 2012 3 2013 3 American Indian or Alaska Native male 5 Deaths per 100,000 resident population All ages, age-adjusted 4 ....... -- -- -- 320.5 264.1 222.2 152.5 152.3 All ages, crude ............. -- -- -- 130.6 108.0 90.1 78.3 82.3 45–54 years ............... -- -- -- 238.1 173.8 108.5 87.4 101.6 55–64 years ............... -- -- -- 496.3 411.0 285.0 198.5 206.2 65–74 years ............... -- -- -- 1,009.4 839.1 748.2 451.5 465.2 75–84 years ............... -- -- -- 2,062.2 1,788.8 1,655.7 1,138.9 1,071.8 85 years and over ........... -- -- -- 4,413.7 3,860.3 3,318.3 2,278.2 2,269.1 Asian or Pacific Islander male 5 All ages, age-adjusted 4 ....... -- -- -- 286.9 220.7 185.5 116.1 118.4 All ages, crude ............. -- -- -- 119.8 88.7 90.6 76.8 81.9 45–54 years ............... -- -- -- 112.0 70.4 61.1 51.8 50.9 55–64 years ............... -- -- -- 306.7 226.1 182.6 118.4 133.3 65–74 years ............... -- -- -- 852.4 623.5 482.5 255.1 274.9 75–84 years ............... -- -- -- 2,010.9 1,642.2 1,354.7 748.7 754.6 85 years and over ........... -- -- -- 5,923.0 4,617.8 4,154.2 2,842.2 2,848.5 Hispanic or Latino male 5,7 All ages, age-adjusted 4 ....... -- -- -- -- 270.0 238.2 151.6 151.5 All ages, crude ............. -- -- -- -- 91.0 74.7 64.3 66.9 45–54 years ............... -- -- -- -- 116.4 84.3 61.7 63.5 55–64 years ............... -- -- -- -- 363.0 264.8 177.5 178.0 65–74 years ............... -- -- -- -- 829.9 684.8 406.1 416.6 75–84 years ............... -- -- -- -- 1,971.3 1,733.2 1,069.1 1,057.5 85 years and over ........... -- -- -- -- 4,711.9 4,897.5 3,147.0 3,106.2 White, not Hispanic or Latino male 7 All ages, age-adjusted 4 ....... -- -- -- -- 413.6 319.9 217.7 217.9 All ages, crude ............. -- -- -- -- 336.5 297.5 253.2 259.0 45–54 years ............... -- -- -- -- 172.8 134.3 115.2 117.2 55–64 years ............... -- -- -- -- 521.3 356.3 259.1 260.2 65–74 years ............... -- -- -- -- 1,243.4 885.1 518.3 520.2 75–84 years ............... -- -- -- -- 3,007.7 2,261.9 1,409.6 1,408.1 85 years and over ........... -- -- -- -- 7,663.4 6,606.6 4,796.1 4,794.2 White female 5 All ages, age-adjusted 4 ....... 479.2 441.7 376.7 315.9 250.9 205.6 133.4 132.0 All ages, crude ............. 290.5 306.5 313.8 319.2 298.4 274.5 196.7 196.8 45–54 years ............... 142.4 103.4 91.4 71.2 50.2 40.9 40.7 41.0 55–64 years ............... 460.7 383.0 317.7 248.1 192.4 141.3 97.8 95.9 65–74 years ............... 1,401.6 1,229.8 1,044.0 796.7 583.6 445.2 251.7 252.5 75–84 years ............... 3,926.2 3,629.7 3,143.5 2,493.6 1,874.3 1,452.4 888.1 871.8 85 years and over ........... 9,086.9 9,280.8 7,839.9 7,501.6 6,563.4 5,801.4 3,855.8 3,821.0 Black or African American female 5 All ages, age-adjusted 4 ....... 538.9 488.9 435.6 378.6 327.5 277.6 172.7 172.1 All ages, crude ............. 289.9 268.5 261.0 249.7 237.0 212.6 150.9 153.4 45–54 years ............... 526.8 360.7 290.9 202.4 155.3 125.0 92.6 94.2 55–64 years ............... 1,210.7 952.3 710.5 530.1 442.0 332.8 211.1 213.0 65–74 years ............... 75–84 years 6 .............. 1,659.4 3,499.3 1,680.5 2,926.9 1,553.2 2,964.1 1,210.3 2,707.2 1,017.5 2,250.9 815.2 1,913.1 449.3 1,114.8 450.8 1,122.2 85 years and over ........... -- 5,650.0 5,003.8 5,796.5 5,766.1 5,298.7 3,513.5 3,425.3 See footnotes at end of table. Health, United States, 2014 Trend Tables 111
- Page 2:
Copyright information Permission ha
- Page 5 and 6:
Preface Health, United States, 2014
- Page 7 and 8:
Accessing Health, United States Hea
- Page 9 and 10:
Contents
- Page 11 and 12:
Trend Tables Health Status and Dete
- Page 13 and 14:
Figure 28. Prescription drug use in
- Page 15 and 16:
List of Trend Tables Health Status
- Page 17 and 18:
Table 64. Healthy weight, overweigh
- Page 19 and 20:
State Health Expenditures and Healt
- Page 21 and 22:
Health, United States, 2014: At a G
- Page 23 and 24:
Highlights This section presents se
- Page 25 and 26:
Use of Preventive Medical Care Serv
- Page 27 and 28:
Chartbook: Figures 1-19
- Page 29 and 30:
Mortality Selected Causes of Death
- Page 31 and 32:
Disability Measures Basic Actions D
- Page 33 and 34:
Health Risk Factors Overweight and
- Page 35 and 36:
Health Insurance Coverage Among Adu
- Page 37 and 38:
Personal Health Care Expenditures M
- Page 39 and 40:
Special Feature on Adults Aged 55-6
- Page 41 and 42:
Health, United States, 2014: Profil
- Page 43 and 44:
Selected Chronic Conditions For adu
- Page 45 and 46:
Current Cigarette Smoking In 2012-2
- Page 47 and 48:
Health Insurance Coverage For adult
- Page 49 and 50:
Use of Preventive Services and Scre
- Page 51 and 52:
Delay or Nonreceipt of Medical Care
- Page 53 and 54:
Data table for Figure 20. Death rat
- Page 55 and 56:
Data table for Figure 22. Serious o
- Page 57 and 58:
Data table for Figure 24. Participa
- Page 59 and 60:
Data table for Figure 26. Health ca
- Page 61 and 62:
Data table for Figure 28. Prescript
- Page 63 and 64:
Technical Notes Data Sources and Co
- Page 65 and 66:
26. Martinez ME, Cohen RA. Health i
- Page 67 and 68:
83. CDC. Vaccine recommendations of
- Page 69 and 70:
Table 1 (page 1 of 3). Resident pop
- Page 71 and 72:
Table 1 (page 3 of 3). Resident pop
- Page 73 and 74:
Table 2 (page 2 of 2). Persons belo
- Page 75 and 76: Table 3 (page 2 of 3). Crude birth
- Page 77 and 78: Table 4 (page 1 of 2). Teenage chil
- Page 79 and 80: Table 5. Nonmarital childbearing, b
- Page 81 and 82: Table 7 (page 1 of 3). Low birthwei
- Page 83 and 84: Table 7 (page 3 of 3). Low birthwei
- Page 85 and 86: Table 9 (page 1 of 6). Contraceptiv
- Page 87 and 88: Table 9 (page 3 of 6). Contraceptiv
- Page 89 and 90: Table 9 (page 5 of 6). Contraceptiv
- Page 91 and 92: Table 10. Breastfeeding among mothe
- Page 93 and 94: Table 11 (page 2 of 2). Infant, neo
- Page 95 and 96: Table 13 (page 1 of 3). Infant mort
- Page 97 and 98: Table 13 (page 3 of 3). Infant mort
- Page 99 and 100: Table 15 (page 1 of 2). Life expect
- Page 101 and 102: Table 16 (page 1 of 2). Life expect
- Page 103 and 104: Table 17 (page 1 of 2). Age-adjuste
- Page 105 and 106: Table 18 (page 1 of 4). Age-adjuste
- Page 107 and 108: Table 18 (page 3 of 4). Age-adjuste
- Page 109 and 110: Table 19 (page 1 of 4). Years of po
- Page 111 and 112: Table 19 (page 3 of 4). Years of po
- Page 113 and 114: Table 20 (page 1 of 4). Leading cau
- Page 115 and 116: Table 20 (page 3 of 4). Leading cau
- Page 117 and 118: Table 21 (page 1 of 2). Leading cau
- Page 119 and 120: Table 22 (page 1 of 3). Age-adjuste
- Page 121 and 122: Table 22 (page 3 of 3). Age-adjuste
- Page 123 and 124: Table 23 (page 2 of 4). Death rates
- Page 125: Table 23 (page 4 of 4). Death rates
- Page 129 and 130: Table 25 (page 1 of 3). Death rates
- Page 131 and 132: Table 25 (page 3 of 3). Death rates
- Page 133 and 134: Table 26 (page 2 of 4). Death rates
- Page 135 and 136: Table 26 (page 4 of 4). Death rates
- Page 137 and 138: Table 27 (page 2 of 3). Death rates
- Page 139 and 140: Table 28 (page 1 of 2). Death rates
- Page 141 and 142: Table 29 (page 1 of 2). Death rates
- Page 143 and 144: Table 30 (page 1 of 3). Death rates
- Page 145 and 146: Table 30 (page 3 of 3). Death rates
- Page 147 and 148: Table 31 (page 2 of 4). Death rates
- Page 149 and 150: Table 31 (page 4 of 4). Death rates
- Page 151 and 152: Table 32 (page 2 of 4). Death rates
- Page 153 and 154: Table 32 (page 4 of 4). Death rates
- Page 155 and 156: Table 33 (page 2 of 3). Death rates
- Page 157 and 158: Table 34 (page 1 of 3). Death rates
- Page 159 and 160: Table 34 (page 3 of 3). Death rates
- Page 161 and 162: Table 36 (page 1 of 2). Occupationa
- Page 163 and 164: Table 37 (page 1 of 2). Selected no
- Page 165 and 166: Table 38 (page 1 of 2). Human immun
- Page 167 and 168: Table 39 (page 1 of 5). Health cond
- Page 169 and 170: Table 39 (page 3 of 5). Health cond
- Page 171 and 172: Table 39 (page 5 of 5). Health cond
- Page 173 and 174: Table 40 (page 2 of 4). Age-adjuste
- Page 175 and 176: Table 40 (page 4 of 4). Age-adjuste
- Page 177 and 178:
Table 42 (page 1 of 2). Respondent-
- Page 179 and 180:
Table 43 (page 1 of 2). Number of r
- Page 181 and 182:
Table 44 (page 1 of 2). Diabetes pr
- Page 183 and 184:
Table 45 (page 1 of 2). End-stage r
- Page 185 and 186:
Table 46 (page 1 of 3). Severe head
- Page 187 and 188:
Table 46 (page 3 of 3). Severe head
- Page 189 and 190:
Table 47 (page 2 of 2). Disability
- Page 191 and 192:
Table 48 (page 2 of 2). Vision limi
- Page 193 and 194:
Table 49 (page 2 of 2). Hearing lim
- Page 195 and 196:
Table 50 (page 2 of 2). Respondent-
- Page 197 and 198:
Table 51 (page 2 of 2). Serious psy
- Page 199 and 200:
Table 52 (page 2 of 2). Current cig
- Page 201 and 202:
Table 54 (page 1 of 3). Current cig
- Page 203 and 204:
Table 54 (page 3 of 3). Current cig
- Page 205 and 206:
Table 55 (page 2 of 2). Use of sele
- Page 207 and 208:
Table 56 (page 2 of 3). Use of sele
- Page 209 and 210:
Table 57 (page 1 of 3). Health risk
- Page 211 and 212:
Table 57 (page 3 of 3). Health risk
- Page 213 and 214:
Table 58 (page 2 of 3). Heavier dri
- Page 215 and 216:
Table 59 (page 1 of 2). Selected he
- Page 217 and 218:
Table 60 (page 1 of 2). Hypertensio
- Page 219 and 220:
Table 61 (page 1 of 4). Cholesterol
- Page 221 and 222:
Table 61 (page 3 of 4). Cholesterol
- Page 223 and 224:
Table 62 (page 1 of 2). Mean macron
- Page 225 and 226:
Table 63 (page 1 of 5). Participati
- Page 227 and 228:
Table 63 (page 3 of 5). Participati
- Page 229 and 230:
Table 63 (page 5 of 5). Participati
- Page 231 and 232:
Table 64 (page 2 of 7). Healthy wei
- Page 233 and 234:
Table 64 (page 4 of 7). Healthy wei
- Page 235 and 236:
Table 64 (page 6 of 7). Healthy wei
- Page 237 and 238:
Table 65 (page 1 of 2). Obesity amo
- Page 239 and 240:
Table 66 (page 1 of 2). Untreated d
- Page 241 and 242:
Table 67 (page 1 of 2). No usual so
- Page 243 and 244:
Table 68 (page 1 of 2). No usual so
- Page 245 and 246:
Table 69 (page 1 of 3). Delay or no
- Page 247 and 248:
Table 69 (page 3 of 3). Delay or no
- Page 249 and 250:
Table 70 (page 2 of 2). No health c
- Page 251 and 252:
Table 71 (page 2 of 3). Health care
- Page 253 and 254:
Table 72 (page 1 of 3). Vaccination
- Page 255 and 256:
Table 72 (page 3 of 3). Vaccination
- Page 257 and 258:
Table 74 (page 1 of 2). Influenza v
- Page 259 and 260:
Table 75 (page 1 of 2). Pneumococca
- Page 261 and 262:
Table 76 (page 1 of 3) . Use of mam
- Page 263 and 264:
Table 76 (page 3 of 3). Use of mamm
- Page 265 and 266:
Table 77 (page 2 of 5). Use of Pap
- Page 267 and 268:
Table 77 (page 4 of 5). Use of Pap
- Page 269 and 270:
Table 78 (page 1 of 2). Use of colo
- Page 271 and 272:
Table 79 (page 1 of 4). Emergency d
- Page 273 and 274:
Table 79 (page 3 of 4). Emergency d
- Page 275 and 276:
Table 80 (page 1 of 3). Emergency d
- Page 277 and 278:
Table 80 (page 3 of 3). Emergency d
- Page 279 and 280:
Table 81 (page 2 of 2). Initial inj
- Page 281 and 282:
Table 82 (page 2 of 3). Visits to p
- Page 283 and 284:
Table 83 (page 1 of 2). Visits to p
- Page 285 and 286:
Table 84 (page 1 of 2) . Dental vis
- Page 287 and 288:
Table 85 (page 1 of 2). Prescriptio
- Page 289 and 290:
Table 86 (page 1 of 3). Selected pr
- Page 291 and 292:
Table 86 (page 3 of 3). Selected pr
- Page 293 and 294:
Table 87 (page 2 of 4). Persons wit
- Page 295 and 296:
Table 87 (page 4 of 4). Persons wit
- Page 297 and 298:
Table 88 (page 2 of 3). Discharges,
- Page 299 and 300:
Table 89 (page 1 of 3). Discharge r
- Page 301 and 302:
Table 89 (page 3 of 3). Discharge r
- Page 303 and 304:
Table 90 (page 2 of 4). Discharges
- Page 305 and 306:
Table 90 (page 4 of 4). Discharges
- Page 307 and 308:
Table 92. Active physicians and phy
- Page 309 and 310:
Table 94. Doctors of medicine in pr
- Page 311 and 312:
Table 96. Healthcare employment and
- Page 313 and 314:
Table 98. Hospitals, beds, and occu
- Page 315 and 316:
Table 100. Occupancy rates in commu
- Page 317 and 318:
Table 101 (page 2 of 2). Nursing ho
- Page 319 and 320:
Table 102 (page 2 of 2). Gross dome
- Page 321 and 322:
Table 103 (page 2 of 2). National h
- Page 323 and 324:
Table 104 (page 2 of 3). Personal h
- Page 325 and 326:
Table 105 (page 1 of 3). Cost of ho
- Page 327 and 328:
Table 105 (page 3 of 3). Cost of ho
- Page 329 and 330:
Table 106 (page 2 of 3). Expenses f
- Page 331 and 332:
Table 107 (page 1 of 3). Sources of
- Page 333 and 334:
Table 107 (page 3 of 3). Sources of
- Page 335 and 336:
Table 109 (page 1 of 2). National h
- Page 337 and 338:
Table 110. Employers' costs per emp
- Page 339 and 340:
Table 111 (page 2 of 3). Private he
- Page 341 and 342:
Table 112 (page 1 of 3). Private he
- Page 343 and 344:
Table 112 (page 3 of 3). Private he
- Page 345 and 346:
Table 113 (page 2 of 3). Medicaid c
- Page 347 and 348:
Table 114 (page 1 of 3). No health
- Page 349 and 350:
Table 114 (page 3 of 3). No health
- Page 351 and 352:
Table 115 (page 2 of 2). Health ins
- Page 353 and 354:
Table 116 (page 2 of 2). Medicare e
- Page 355 and 356:
Table 117 (page 2 of 2). Medicare b
- Page 357 and 358:
Table 118 (page 2 of 2). Medicaid b
- Page 359 and 360:
Table 120. Department of Veterans A
- Page 361 and 362:
Table 121 (page 2 of 2). Medicare e
- Page 363 and 364:
Table 123 (page 1 of 3). Persons un
- Page 365 and 366:
Table 123 (page 3 of 3). Persons un
- Page 367 and 368:
Appendix Contents Appendix I. Data
- Page 369 and 370:
Mammography .......................
- Page 371 and 372:
Appendix I. Data Sources Health, Un
- Page 373 and 374:
institutional group quarters popula
- Page 375 and 376:
entire survey. In addition, some of
- Page 377 and 378:
Another source of Medicaid informat
- Page 379 and 380:
For More Information. See the CMS R
- Page 381 and 382:
Sample data are weighted to produce
- Page 383 and 384:
The estimation procedure used to pr
- Page 385 and 386:
with the Armed Forces (although the
- Page 387 and 388:
areas. EDs are treated as their own
- Page 389 and 390:
Methodology. NIS is a nationwide te
- Page 391 and 392:
National Notifiable Diseases Survei
- Page 393 and 394:
interviewing (ACASI), are used to p
- Page 395 and 396:
Coverage. Data presented in Health,
- Page 397 and 398:
Heron M, Hoyert DL, Murphy SL, et a
- Page 399 and 400:
specified rules for the collection,
- Page 401 and 402:
Quality Improvement Evaluation Syst
- Page 403 and 404:
information on treatment and payer
- Page 405 and 406:
Reference American Dental Associati
- Page 407 and 408:
For More Information. See The Guttm
- Page 409 and 410:
Table I. United States projected ye
- Page 411 and 412:
males and black females in 1950 are
- Page 413 and 414:
hypertension. Those with uncontroll
- Page 415 and 416:
Table IV. Cause-of-death codes, by
- Page 417 and 418:
High Blood Cholesterol in Adults (A
- Page 419 and 420:
Table V. Comparability of selected
- Page 421 and 422:
Dental caries was identified by an
- Page 423 and 424:
For more information on prescriptio
- Page 425 and 426:
public-use data release. NCHS. 2014
- Page 427 and 428:
Figure I. U.S. Census Bureau: Four
- Page 429 and 430:
with only Indian Health Service (IH
- Page 431 and 432:
Table VII. Percentage of persons un
- Page 433 and 434:
analytic purposes. See: NAACCR guid
- Page 435 and 436:
cause of death in ICD-9. The asteri
- Page 437 and 438:
Table IX. Codes for external causes
- Page 439 and 440:
U.S. life tables by Hispanic origin
- Page 441 and 442:
for Healthcare Research and Quality
- Page 443 and 444:
Affordable Care Act Provides Eligib
- Page 445 and 446:
Micropolitan statistical area—The
- Page 447 and 448:
In 2000 and 2003, women were asked
- Page 449 and 450:
see Appendix I, Population Census a
- Page 451 and 452:
Table XII. Codes for procedure cate
- Page 453 and 454:
Table XIV. Private health care cove
- Page 455 and 456:
the extent that race and Hispanic o
- Page 457 and 458:
Perinatal mortality rates and ratio
- Page 459 and 460:
coverage are considered uninsured.
- Page 461 and 462:
Index
- Page 463 and 464:
A—Con. Table/Figure (F) Asian or
- Page 465 and 466:
D Table/Figure (F) Deaths, death ra
- Page 467 and 468:
H—Con. Table/Figure (F) Hispanic
- Page 469 and 470:
M—Con. Table/Figure (F) Metropoli
- Page 471 and 472:
S Table/Figure (F) Salmonellosis, s