

hus14
hus14
hus14

You also want an ePaper? Increase the reach of your titles
YUMPU automatically turns print PDFs into web optimized ePapers that Google loves.
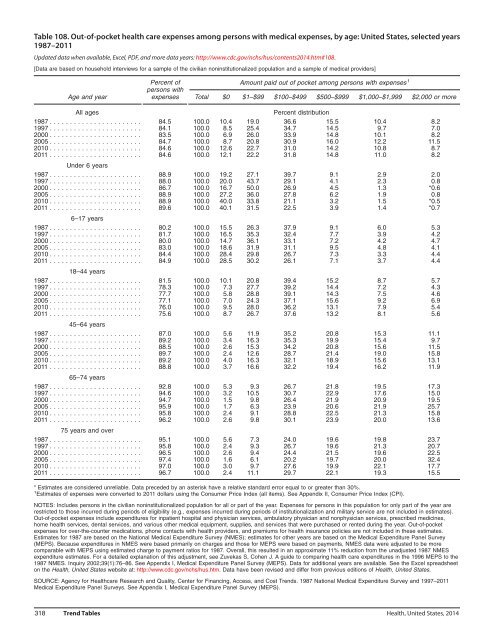
Table 108. Out-of-pocket health care expenses among persons with medical expenses, by age: United States, selected years<br />
1987–2011<br />
Updated data when available, Excel, PDF, and more data years: http://www.cdc.gov/nchs/hus/contents2014.htm#108.<br />
[Data are based on household interviews for a sample of the civilian noninstitutionalized population and a sample of medical providers]<br />
Percent of Amount paid out of pocket among persons with expenses 1<br />
persons with<br />
Age and year expenses Total $0 $1–$99 $100–$499 $500–$999 $1,000–$1,999 $2,000 or more<br />
All ages<br />
Percent distribution<br />
1987 ....................... 84.5 100.0 10.4 19.0 36.6 15.5 10.4 8.2<br />
1997 ....................... 84.1 100.0 8.5 25.4 34.7 14.5 9.7 7.0<br />
2000 ....................... 83.5 100.0 6.9 26.0 33.9 14.8 10.1 8.2<br />
2005 ....................... 84.7 100.0 8.7 20.8 30.9 16.0 12.2 11.5<br />
2010 ....................... 84.6 100.0 12.6 22.7 31.0 14.2 10.8 8.7<br />
2011....................... 84.6 100.0 12.1 22.2 31.8 14.8 11.0 8.2<br />
Under 6 years<br />
1987 ....................... 88.9 100.0 19.2 27.1 39.7 9.1 2.9 2.0<br />
1997 ....................... 88.0 100.0 20.0 43.7 29.1 4.1 2.3 0.8<br />
2000 ....................... 86.7 100.0 16.7 50.0 26.9 4.5 1.3 *0.6<br />
2005 ....................... 88.9 100.0 27.2 36.0 27.8 6.2 1.9 0.8<br />
2010 ....................... 88.9 100.0 40.0 33.8 21.1 3.2 1.5 *0.5<br />
2011....................... 89.6 100.0 40.1 31.5 22.5 3.9 1.4 *0.7<br />
6–17 years<br />
1987 ....................... 80.2 100.0 15.5 26.3 37.9 9.1 6.0 5.3<br />
1997 ....................... 81.7 100.0 16.5 35.3 32.4 7.7 3.9 4.2<br />
2000 ....................... 80.0 100.0 14.7 36.1 33.1 7.2 4.2 4.7<br />
2005 ....................... 83.0 100.0 18.6 31.9 31.1 9.5 4.8 4.1<br />
2010 ....................... 84.4 100.0 28.4 29.8 26.7 7.3 3.3 4.4<br />
2011....................... 84.9 100.0 28.5 30.2 26.1 7.1 3.7 4.4<br />
18–44 years<br />
1987 ....................... 81.5 100.0 10.1 20.8 39.4 15.2 8.7 5.7<br />
1997 ....................... 78.3 100.0 7.3 27.7 39.2 14.4 7.2 4.3<br />
2000 ....................... 77.7 100.0 5.8 28.8 39.1 14.3 7.5 4.6<br />
2005 ....................... 77.1 100.0 7.0 24.3 37.1 15.6 9.2 6.9<br />
2010 ....................... 76.0 100.0 9.5 28.0 36.2 13.1 7.9 5.4<br />
2011....................... 75.6 100.0 8.7 26.7 37.6 13.2 8.1 5.6<br />
45–64 years<br />
1987 ....................... 87.0 100.0 5.6 11.9 35.2 20.8 15.3 11.1<br />
1997 ....................... 89.2 100.0 3.4 16.3 35.3 19.9 15.4 9.7<br />
2000 ....................... 88.5 100.0 2.6 15.3 34.2 20.8 15.6 11.5<br />
2005 ....................... 89.7 100.0 2.4 12.6 28.7 21.4 19.0 15.8<br />
2010 ....................... 89.2 100.0 4.0 16.3 32.1 18.9 15.6 13.1<br />
2011....................... 88.8 100.0 3.7 16.6 32.2 19.4 16.2 11.9<br />
65–74 years<br />
1987 ....................... 92.8 100.0 5.3 9.3 26.7 21.8 19.5 17.3<br />
1997 ....................... 94.6 100.0 3.2 10.5 30.7 22.9 17.6 15.0<br />
2000 ....................... 94.7 100.0 1.5 9.8 26.4 21.9 20.9 19.5<br />
2005 ....................... 95.9 100.0 1.7 6.3 23.9 20.6 21.9 25.7<br />
2010 ....................... 95.8 100.0 2.4 9.1 28.8 22.5 21.3 15.8<br />
2011....................... 96.2 100.0 2.6 9.8 30.1 23.9 20.0 13.6<br />
75 years and over<br />
1987 ....................... 95.1 100.0 5.6 7.3 24.0 19.6 19.8 23.7<br />
1997 ....................... 95.8 100.0 2.4 9.3 26.7 19.6 21.3 20.7<br />
2000 ....................... 96.5 100.0 2.6 9.4 24.4 21.5 19.6 22.5<br />
2005 ....................... 97.4 100.0 1.6 6.1 20.2 19.7 20.0 32.4<br />
2010 ....................... 97.0 100.0 3.0 9.7 27.6 19.9 22.1 17.7<br />
2011....................... 96.7 100.0 2.4 11.1 29.7 22.1 19.3 15.5<br />
* Estimates are considered unreliable. Data preceded by an asterisk have a relative standard error equal to or greater than 30%.<br />
1 Estimates of expenses were converted to 2011 dollars using the Consumer Price Index (all items). See Appendix II, Consumer Price Index (CPI).<br />
NOTES: Includes persons in the civilian noninstitutionalized population for all or part of the year. Expenses for persons in this population for only part of the year are<br />
restricted to those incurred during periods of eligibility (e.g., expenses incurred during periods of institutionalization and military service are not included in estimates).<br />
Out-of-pocket expenses include expenditures for inpatient hospital and physician services, ambulatory physician and nonphysician services, prescribed medicines,<br />
home health services, dental services, and various other medical equipment, supplies, and services that were purchased or rented during the year. Out-of-pocket<br />
expenses for over-the-counter medications, phone contacts with health providers, and premiums for health insurance policies are not included in these estimates.<br />
Estimates for 1987 are based on the National Medical Expenditure Survey (NMES); estimates for other years are based on the Medical Expenditure Panel Survey<br />
(MEPS). Because expenditures in NMES were based primarily on charges and those for MEPS were based on payments, NMES data were adjusted to be more<br />
comparable with MEPS using estimated charge to payment ratios for 1987. Overall, this resulted in an approximate 11% reduction from the unadjusted 1987 NMES<br />
expenditure estimates. For a detailed explanation of this adjustment, see Zuvekas S, Cohen J. A guide to comparing health care expenditures in the 1996 MEPS to the<br />
1987 NMES. Inquiry 2002;39(1):76–86. See Appendix I, Medical Expenditure Panel Survey (MEPS). Data for additional years are available. See the Excel spreadsheet<br />
on the Health, United States website at: http://www.cdc.gov/nchs/hus.htm. Data have been revised and differ from previous editions of Health, United States.<br />
SOURCE: Agency for Healthcare Research and Quality, Center for Financing, Access, and Cost Trends. 1987 National Medical Expenditure Survey and 1997–2011<br />
Medical Expenditure Panel Surveys. See Appendix I, Medical Expenditure Panel Survey (MEPS).<br />
318 Trend Tables<br />
Health, United States, 2014