

hus14
hus14
hus14

Create successful ePaper yourself
Turn your PDF publications into a flip-book with our unique Google optimized e-Paper software.
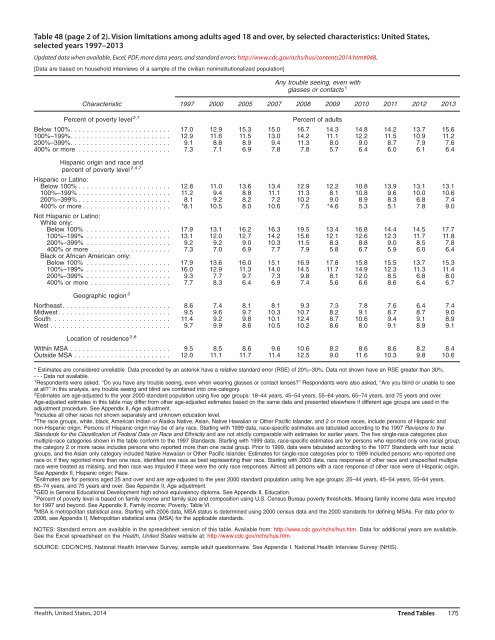
Table 48 (page 2 of 2). Vision limitations among adults aged 18 and over, by selected characteristics: United States,<br />
selected years 1997–2013<br />
Updated data when available, Excel, PDF, more data years, and standard errors: http://www.cdc.gov/nchs/hus/contents2014.htm#048.<br />
[Data are based on household interviews of a sample of the civilian noninstitutionalized population]<br />
Any trouble seeing, even with<br />
glasses or contacts 1<br />
Characteristic 1997 2000 2005 2007 2008 2009 2010 2011 2012 2013<br />
Percent of poverty level 2,7<br />
Percent of adults<br />
Below 100%. ........................ 17.0 12.9 15.3 15.0 16.7 14.3 14.8 14.2 13.7 15.6<br />
100%–199%. ........................ 12.9 11.6 11.5 13.0 14.2 11.1 12.2 11.5 10.9 11.2<br />
200%–399%. ........................ 9.1 8.8 8.9 9.4 11.3 8.0 9.0 8.7 7.9 7.6<br />
400% or more ....................... 7.3 7.1 6.9 7.8 7.8 5.7 6.4 6.0 6.1 6.4<br />
Hispanic origin and race and<br />
percent of poverty level 2,4,7<br />
Hispanic or Latino:<br />
Below 100% ....................... 12.8 11.0 13.6 13.4 12.9 12.2 10.8 13.9 13.1 13.1<br />
100%–199% ....................... 11.2 9.4 8.8 11.1 11.3 8.1 10.8 9.6 10.0 10.6<br />
200%–399% ....................... 8.1 9.2 8.2 7.2 10.2 9.0 8.9 8.3 6.8 7.4<br />
400% or more ...................... *8.1 10.5 8.0 10.6 7.5 *4.6 5.3 5.1 7.8 9.0<br />
Not Hispanic or Latino:<br />
White only:<br />
Below 100% ..................... 17.9 13.1 16.2 16.3 19.5 13.4 16.8 14.4 14.5 17.7<br />
100%–199% ..................... 13.1 12.0 12.7 14.2 15.6 12.1 12.6 12.3 11.7 11.8<br />
200%–399% ..................... 9.2 9.2 9.0 10.3 11.5 8.3 8.8 9.0 8.5 7.8<br />
400% or more .................... 7.3 7.0 6.9 7.7 7.9 5.8 6.7 5.9 6.0 6.4<br />
Black or African American only:<br />
Below 100% ..................... 17.9 13.6 16.0 15.1 16.9 17.8 15.8 15.5 13.7 15.3<br />
100%–199% ..................... 16.0 12.9 11.3 14.0 14.5 11.7 14.9 12.3 11.3 11.4<br />
200%–399% ..................... 9.3 7.7 9.7 7.3 9.8 8.1 12.0 8.5 6.8 8.0<br />
400% or more .................... 7.7 8.3 6.4 6.9 7.4 5.6 6.6 8.6 6.4 6.7<br />
Geographic region 2<br />
Northeast ........................... 8.6 7.4 8.1 8.1 9.3 7.3 7.8 7.6 6.4 7.4<br />
Midwest ............................ 9.5 9.6 9.7 10.3 10.7 8.2 9.1 8.7 8.7 9.0<br />
South ............................. 11.4 9.2 9.8 10.1 12.4 8.7 10.6 9.4 9.1 8.9<br />
West .............................. 9.7 9.9 8.6 10.5 10.2 8.6 8.0 9.1 8.9 9.1<br />
Location of residence 2,8<br />
Within MSA ......................... 9.5 8.5 8.6 9.6 10.6 8.2 8.6 8.6 8.2 8.4<br />
Outside MSA ........................ 12.0 11.1 11.7 11.4 12.5 9.0 11.6 10.3 9.8 10.6<br />
* Estimates are considered unreliable. Data preceded by an asterisk have a relative standard error (RSE) of 20%–30%. Data not shown have an RSE greater than 30%.<br />
---Data not available.<br />
1 Respondents were asked, ‘‘Do you have any trouble seeing, even when wearing glasses or contact lenses?’’ Respondents were also asked, ‘‘Are you blind or unable to see<br />
at all?’’ In this analysis, any trouble seeing and blind are combined into one category.<br />
2 Estimates are age-adjusted to the year 2000 standard population using five age groups: 18–44 years, 45–54 years, 55–64 years, 65–74 years, and 75 years and over.<br />
Age-adjusted estimates in this table may differ from other age-adjusted estimates based on the same data and presented elsewhere if different age groups are used in the<br />
adjustment procedure. See Appendix II, Age adjustment.<br />
3 Includes all other races not shown separately and unknown education level.<br />
4 The race groups, white, black, American Indian or Alaska Native, Asian, Native Hawaiian or Other Pacific Islander, and 2 or more races, include persons of Hispanic and<br />
non-Hispanic origin. Persons of Hispanic origin may be of any race. Starting with 1999 data, race-specific estimates are tabulated according to the 1997 Revisions to the<br />
Standards for the Classification of Federal Data on Race and Ethnicity and are not strictly comparable with estimates for earlier years. The five single-race categories plus<br />
multiple-race categories shown in the table conform to the 1997 Standards. Starting with 1999 data, race-specific estimates are for persons who reported only one racial group;<br />
the category 2 or more races includes persons who reported more than one racial group. Prior to 1999, data were tabulated according to the 1977 Standards with four racial<br />
groups, and the Asian only category included Native Hawaiian or Other Pacific Islander. Estimates for single-race categories prior to 1999 included persons who reported one<br />
race or, if they reported more than one race, identified one race as best representing their race. Starting with 2003 data, race responses of other race and unspecified multiple<br />
race were treated as missing, and then race was imputed if these were the only race responses. Almost all persons with a race response of other race were of Hispanic origin.<br />
See Appendix II, Hispanic origin; Race.<br />
5 Estimates are for persons aged 25 and over and are age-adjusted to the year 2000 standard population using five age groups: 25–44 years, 45–54 years, 55–64 years,<br />
65–74 years, and 75 years and over. See Appendix II, Age adjustment.<br />
6 GED is General Educational Development high school equivalency diploma. See Appendix II, Education.<br />
7 Percent of poverty level is based on family income and family size and composition using U.S. Census Bureau poverty thresholds. Missing family income data were imputed<br />
for 1997 and beyond. See Appendix II, Family income; Poverty; Table VI.<br />
8 MSA is metropolitan statistical area. Starting with 2006 data, MSA status is determined using 2000 census data and the 2000 standards for defining MSAs. For data prior to<br />
2006, see Appendix II, Metropolitan statistical area (MSA) for the applicable standards.<br />
NOTES: Standard errors are available in the spreadsheet version of this table. Available from: http://www.cdc.gov/nchs/hus.htm. Data for additional years are available.<br />
See the Excel spreadsheet on the Health, United States website at: http://www.cdc.gov/nchs/hus.htm.<br />
SOURCE: CDC/NCHS, National Health Interview Survey, sample adult questionnaire. See Appendix I, National Health Interview Survey (NHIS).<br />
Health, United States, 2014<br />
Trend Tables 175