

hus14
hus14
hus14

You also want an ePaper? Increase the reach of your titles
YUMPU automatically turns print PDFs into web optimized ePapers that Google loves.
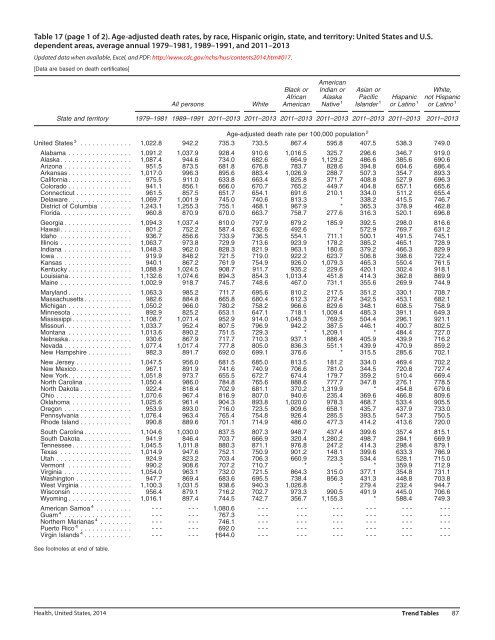
Table 17 (page 1 of 2). Age-adjusted death rates, by race, Hispanic origin, state, and territory: United States and U.S.<br />
dependent areas, average annual 1979–1981, 1989–1991, and 2011–2013<br />
Updated data when available, Excel, and PDF: http://www.cdc.gov/nchs/hus/contents2014.htm#017.<br />
[Data are based on death certificates]<br />
American<br />
Black or Indian or Asian or White,<br />
African Alaska Pacific Hispanic not Hispanic<br />
All persons White American Native 1 Islander 1 or Latino 1 or Latino 1<br />
State and territory 1979–1981 1989–1991 2011–2013 2011–2013 2011–2013 2011–2013 2011–2013 2011–2013 2011–2013<br />
Age-adjusted death rate per 100,000 population 2<br />
United States 3 ............. 1,022.8 942.2 735.3 733.5 867.4 595.8 407.5 538.3 749.0<br />
Alabama ................ 1,091.2 1,037.9 928.4 910.6 1,016.5 325.7 296.6 346.7 919.0<br />
Alaska. ................. 1,087.4 944.6 734.0 682.6 664.9 1,129.2 486.6 385.6 690.6<br />
Arizona ................. 951.5 873.5 681.8 676.8 783.7 828.6 394.8 604.6 686.4<br />
Arkansas ................ 1,017.0 996.3 895.6 883.4 1,026.9 288.7 507.3 354.7 893.3<br />
California ................ 975.5 911.0 633.8 663.4 825.8 371.7 408.8 527.9 696.3<br />
Colorado ................ 941.1 856.1 666.0 670.7 765.2 449.7 404.8 657.1 665.6<br />
Connecticut .............. 961.5 857.5 651.7 654.1 691.6 210.1 334.0 511.2 655.4<br />
Delaware ................ 1,069.7 1,001.9 745.0 740.6 813.3 * 338.2 415.5 746.7<br />
District of Columbia ........ 1,243.1 1,255.3 755.1 468.1 967.9 * 365.3 378.9 462.8<br />
Florida. ................. 960.8 870.9 670.0 663.7 758.7 277.6 316.3 520.1 696.8<br />
Georgia ................. 1,094.3 1,037.4 810.0 797.9 879.2 185.9 392.5 298.0 816.6<br />
Hawaii.................. 801.2 752.2 587.4 632.6 492.6 * 572.9 769.7 631.2<br />
Idaho .................. 936.7 856.6 733.9 736.5 554.1 711.1 500.1 491.5 745.1<br />
Illinois .................. 1,063.7 973.8 729.9 713.6 923.9 178.2 385.2 465.1 728.9<br />
Indiana ................. 1,048.3 962.0 828.3 821.9 963.1 180.6 379.2 466.3 829.9<br />
Iowa ................... 919.9 848.2 721.5 719.0 922.2 623.7 506.8 398.6 722.4<br />
Kansas ................. 940.1 867.2 761.9 754.9 926.0 1,079.3 465.3 550.4 761.5<br />
Kentucky ................ 1,088.9 1,024.5 908.7 911.7 935.2 229.6 420.1 302.4 918.1<br />
Louisiana. ............... 1,132.6 1,074.6 894.3 854.3 1,013.4 451.8 414.3 362.8 869.9<br />
Maine .................. 1,002.9 918.7 745.7 748.6 467.0 731.1 355.6 269.9 744.9<br />
Maryland ................ 1,063.3 985.2 711.7 695.6 810.2 217.5 351.2 330.1 708.7<br />
Massachusetts ............ 982.6 884.8 665.8 680.4 612.3 272.4 342.5 453.1 682.1<br />
Michigan ................ 1,050.2 966.0 780.2 758.2 966.6 829.6 348.1 608.5 758.9<br />
Minnesota ............... 892.9 825.2 653.1 647.1 718.1 1,009.4 485.3 391.1 649.3<br />
Mississippi ............... 1,108.7 1,071.4 952.9 914.0 1,045.3 769.5 504.4 296.1 921.1<br />
Missouri. ................ 1,033.7 952.4 807.5 796.9 942.2 387.5 446.1 400.7 802.5<br />
Montana ................ 1,013.6 890.2 751.5 729.3 * 1,209.1 * 484.4 727.0<br />
Nebraska. ............... 930.6 867.9 717.7 710.3 937.1 886.4 405.9 439.9 716.2<br />
Nevada ................. 1,077.4 1,017.4 777.8 805.0 836.3 551.1 439.9 470.9 859.2<br />
New Hampshire ........... 982.3 891.7 692.0 699.1 376.6 * 315.5 285.6 702.1<br />
New Jersey .............. 1,047.5 956.0 681.5 685.0 813.5 181.2 334.0 469.4 702.2<br />
New Mexico. ............. 967.1 891.9 741.6 740.9 706.6 781.0 344.5 720.8 727.4<br />
New York................ 1,051.8 973.7 655.5 672.7 674.4 179.7 359.2 510.4 669.4<br />
North Carolina ............ 1,050.4 986.0 784.8 765.6 888.6 777.7 347.8 276.1 778.5<br />
North Dakota ............. 922.4 818.4 702.9 681.1 370.2 1,319.9 * 454.8 679.6<br />
Ohio ................... 1,070.6 967.4 816.9 807.0 940.6 235.4 369.6 466.8 809.6<br />
Oklahoma ............... 1,025.6 961.4 904.3 893.8 1,020.0 978.3 468.7 533.4 905.5<br />
Oregon ................. 953.9 893.0 716.0 723.5 809.6 658.1 435.7 437.9 733.0<br />
Pennsylvania ............. 1,076.4 963.4 765.4 754.8 926.4 285.5 393.5 547.3 750.5<br />
Rhode Island ............. 990.8 889.6 701.1 714.9 486.0 477.3 414.2 413.6 720.0<br />
South Carolina ............ 1,104.6 1,030.0 837.5 807.3 948.7 437.4 399.6 357.4 815.1<br />
South Dakota ............. 941.9 846.4 703.7 666.9 320.4 1,280.2 498.7 284.1 669.9<br />
Tennessee ............... 1,045.5 1,011.8 880.3 871.1 976.8 247.2 414.3 298.4 879.1<br />
Texas .................. 1,014.9 947.6 752.1 750.9 901.2 148.1 399.6 633.3 786.9<br />
Utah ................... 924.9 823.2 703.4 706.3 660.9 723.3 534.4 528.1 715.0<br />
Vermont ................ 990.2 908.6 707.2 710.7 * * * 359.9 712.9<br />
Virginia ................. 1,054.0 963.1 732.0 721.5 864.3 315.0 377.1 354.8 731.1<br />
Washington .............. 947.7 869.4 683.6 695.5 738.4 856.3 431.3 448.8 703.8<br />
West Virginia ............. 1,100.3 1,031.5 938.6 940.3 1,026.8 * 279.4 232.4 944.7<br />
Wisconsin ............... 956.4 879.1 716.2 702.7 973.3 990.5 491.9 445.0 706.6<br />
Wyoming ................ 1,016.1 897.4 744.5 742.7 356.7 1,155.3 * 588.4 749.3<br />
American Samoa 4 .........<br />
Guam 4 .................<br />
--<br />
--<br />
--<br />
--<br />
1,080.6<br />
767.3<br />
- - <br />
- - <br />
- - <br />
- - <br />
- - <br />
- - <br />
- - <br />
- - <br />
- - <br />
- - <br />
- - <br />
- - <br />
Northern Marianas 4 ........ -- -- 746.1 - - - - - - - - - - - - <br />
Puerto Rico 4 ............. -- -- 692.0 - - - - - - - - - - - - <br />
Virgin Islands 4 ............ -- -- †644.0 - - - - - - - - - - - - <br />
See footnotes at end of table.<br />
Health, United States, 2014 Trend Tables 87