

hus14
hus14
hus14

Create successful ePaper yourself
Turn your PDF publications into a flip-book with our unique Google optimized e-Paper software.
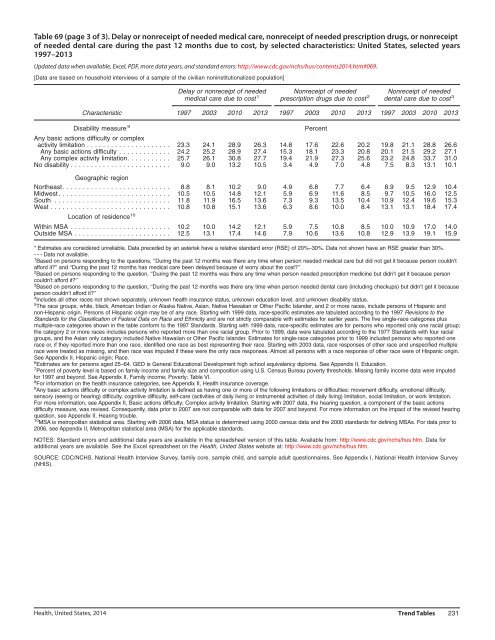
Table 69 (page 3 of 3). Delay or nonreceipt of needed medical care, nonreceipt of needed prescription drugs, or nonreceipt<br />
of needed dental care during the past 12 months due to cost, by selected characteristics: United States, selected years<br />
1997–2013<br />
Updated data when available, Excel, PDF, more data years, and standard errors: http://www.cdc.gov/nchs/hus/contents2014.htm#069.<br />
[Data are based on household interviews of a sample of the civilian noninstitutionalized population]<br />
Delay or nonreceipt of needed<br />
medical care due to cost 1<br />
Nonreceipt of needed<br />
prescription drugs due to cost 2<br />
Nonreceipt of needed<br />
dental care due to cost 3<br />
Characteristic 1997 2003 2010 2013 1997 2003 2010 2013 1997 2003 2010 2013<br />
Disability measure 9<br />
Any basic actions difficulty or complex<br />
activity limitation . ....................<br />
Any basic actions difficulty .............<br />
Any complex activity limitation. ..........<br />
No disability . ........................<br />
23.3<br />
24.2<br />
25.7<br />
9.0<br />
24.1<br />
25.2<br />
26.1<br />
9.0<br />
28.9<br />
28.9<br />
30.8<br />
13.2<br />
26.3<br />
27.4<br />
27.7<br />
10.5<br />
14.8<br />
15.3<br />
19.4<br />
3.4<br />
Percent<br />
17.6<br />
18.1<br />
21.9<br />
4.9<br />
22.6<br />
23.3<br />
27.3<br />
7.0<br />
20.2<br />
20.8<br />
25.6<br />
4.8<br />
19.8<br />
20.1<br />
23.2<br />
7.5<br />
21.1<br />
21.5<br />
24.8<br />
8.3<br />
28.8<br />
29.2<br />
33.7<br />
13.1<br />
26.6<br />
27.1<br />
31.0<br />
10.1<br />
Geographic region<br />
Northeast ...........................<br />
Midwest ............................<br />
South .............................<br />
West ..............................<br />
Location of residence 10<br />
Within MSA .........................<br />
Outside MSA ........................<br />
8.8<br />
10.5<br />
11.8<br />
10.8<br />
10.2<br />
12.5<br />
8.1<br />
10.5<br />
11.9<br />
10.8<br />
10.0<br />
13.1<br />
10.2<br />
14.8<br />
16.5<br />
15.1<br />
14.2<br />
17.4<br />
9.0<br />
12.1<br />
13.6<br />
13.6<br />
12.1<br />
14.6<br />
4.9<br />
5.9<br />
7.3<br />
6.3<br />
5.9<br />
7.9<br />
6.8<br />
6.9<br />
9.3<br />
8.6<br />
7.5<br />
10.6<br />
7.7<br />
11.6<br />
13.5<br />
10.0<br />
10.8<br />
13.6<br />
6.4<br />
8.5<br />
10.4<br />
8.4<br />
8.5<br />
10.8<br />
8.9<br />
9.7<br />
10.9<br />
13.1<br />
10.0<br />
12.9<br />
9.5<br />
10.5<br />
12.4<br />
13.1<br />
10.9<br />
13.9<br />
12.9<br />
16.0<br />
19.6<br />
18.4<br />
17.0<br />
19.1<br />
10.4<br />
12.5<br />
15.3<br />
17.4<br />
14.0<br />
15.9<br />
* Estimates are considered unreliable. Data preceded by an asterisk have a relative standard error (RSE) of 20%–30%. Data not shown have an RSE greater than 30%.<br />
---Data not available.<br />
1 Based on persons responding to the questions, ‘‘During the past 12 months was there any time when person needed medical care but did not get it because person couldn’t<br />
afford it?’’ and ‘‘During the past 12 months has medical care been delayed because of worry about the cost?’’<br />
2 Based on persons responding to the question, ‘‘During the past 12 months was there any time when person needed prescription medicine but didn’t get it because person<br />
couldn’t afford it?’’<br />
3 Based on persons responding to the question, ‘‘During the past 12 months was there any time when person needed dental care (including checkups) but didn’t get it because<br />
person couldn’t afford it?’’<br />
4 Includes all other races not shown separately, unknown health insurance status, unknown education level, and unknown disability status.<br />
5 The race groups, white, black, American Indian or Alaska Native, Asian, Native Hawaiian or Other Pacific Islander, and 2 or more races, include persons of Hispanic and<br />
non-Hispanic origin. Persons of Hispanic origin may be of any race. Starting with 1999 data, race-specific estimates are tabulated according to the 1997 Revisions to the<br />
Standards for the Classification of Federal Data on Race and Ethnicity and are not strictly comparable with estimates for earlier years. The five single-race categories plus<br />
multiple-race categories shown in the table conform to the 1997 Standards. Starting with 1999 data, race-specific estimates are for persons who reported only one racial group;<br />
the category 2 or more races includes persons who reported more than one racial group. Prior to 1999, data were tabulated according to the 1977 Standards with four racial<br />
groups, and the Asian only category included Native Hawaiian or Other Pacific Islander. Estimates for single-race categories prior to 1999 included persons who reported one<br />
race or, if they reported more than one race, identified one race as best representing their race. Starting with 2003 data, race responses of other race and unspecified multiple<br />
race were treated as missing, and then race was imputed if these were the only race responses. Almost all persons with a race response of other race were of Hispanic origin.<br />
See Appendix II, Hispanic origin; Race.<br />
6 Estimates are for persons aged 25–64. GED is General Educational Development high school equivalency diploma. See Appendix II, Education.<br />
7 Percent of poverty level is based on family income and family size and composition using U.S. Census Bureau poverty thresholds. Missing family income data were imputed<br />
for 1997 and beyond. See Appendix II, Family income; Poverty; Table VI.<br />
8 For information on the health insurance categories, see Appendix II, Health insurance coverage.<br />
9 Any basic actions difficulty or complex activity limitation is defined as having one or more of the following limitations or difficulties: movement difficulty, emotional difficulty,<br />
sensory (seeing or hearing) difficulty, cognitive difficulty, self-care (activities of daily living or instrumental activities of daily living) limitation, social limitation, or work limitation.<br />
For more information, see Appendix II, Basic actions difficulty; Complex activity limitation. Starting with 2007 data, the hearing question, a component of the basic actions<br />
difficulty measure, was revised. Consequently, data prior to 2007 are not comparable with data for 2007 and beyond. For more information on the impact of the revised hearing<br />
question, see Appendix II, Hearing trouble.<br />
10 MSA is metropolitan statistical area. Starting with 2006 data, MSA status is determined using 2000 census data and the 2000 standards for defining MSAs. For data prior to<br />
2006, see Appendix II, Metropolitan statistical area (MSA) for the applicable standards.<br />
NOTES: Standard errors and additional data years are available in the spreadsheet version of this table. Available from: http://www.cdc.gov/nchs/hus.htm. Data for<br />
additional years are available. See the Excel spreadsheet on the Health, United States website at: http://www.cdc.gov/nchs/hus.htm.<br />
SOURCE: CDC/NCHS, National Health Interview Survey, family core, sample child, and sample adult questionnaires. See Appendix I, National Health Interview Survey<br />
(NHIS).<br />
Health, United States, 2014 Trend Tables 231