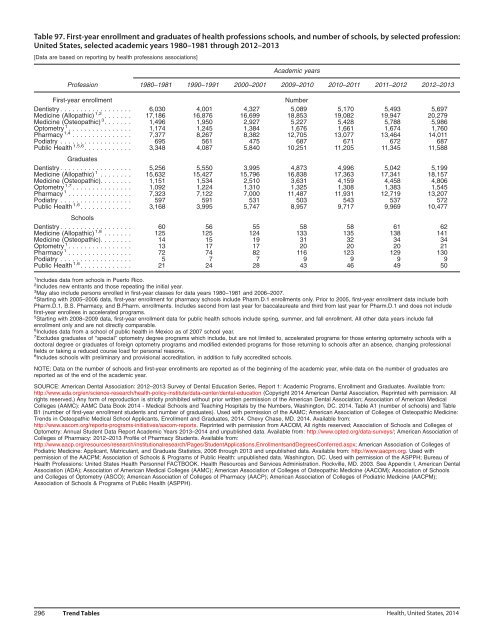
Table 97. First-year enrollment and graduates of health professions schools, and number of schools, by selected profession: United States, selected academic years 1980–1981 through 2012–2013 [Data are based on reporting by health professions associations] Academic years Profession 1980–1981 1990–1991 2000–2001 2009–2010 2010–2011 2011–2012 2012–2013 First-year enrollment Dentistry .................. Medicine (Allopathic) 1,2 ....... Medicine (Osteopathic) 3 ....... Optometry 1 ................ Pharmacy 1,4 ............... Podiatry .................. Public Health 1,5,6 ............ 6,030 17,186 1,496 1,174 7,377 695 3,348 4,001 16,876 1,950 1,245 8,267 561 4,087 4,327 16,699 2,927 1,384 8,382 475 5,840 Number 5,089 18,853 5,227 1,676 12,705 687 10,251 5,170 19,082 5,428 1,661 13,077 671 11,205 5,493 19,947 5,788 1,674 13,464 672 11,345 5,697 20,279 5,986 1,760 14,011 687 11,588 Graduates Dentistry .................. Medicine (Allopathic) 1 ........ Medicine (Osteopathic). ....... Optometry 1,7 ............... Pharmacy 1 ................ Podiatry .................. Public Health 1,6 ............. 5,256 15,632 1,151 1,092 7,323 597 3,168 5,550 15,427 1,534 1,224 7,122 591 3,995 3,995 15,796 2,510 1,310 7,000 531 5,747 4,873 16,838 3,631 1,325 11,487 503 8,957 4,996 17,363 4,159 1,308 11,931 543 9,717 5,042 17,341 4,458 1,383 12,719 537 9,969 5,199 18,157 4,806 1,545 13,207 572 10,477 Schools Dentistry .................. Medicine (Allopathic) 1,8 ....... Medicine (Osteopathic). ....... Optometry 1 ................ Pharmacy 1 ................ Podiatry .................. Public Health 1,6 ............. 60 125 14 13 72 5 21 56 125 15 17 74 7 24 55 124 19 17 82 7 28 58 133 31 20 116 9 43 58 135 32 20 123 9 46 61 138 34 20 129 9 49 62 141 34 21 130 9 50 1 Includes data from schools in Puerto Rico. 2 Includes new entrants and those repeating the initial year. 3 May also include persons enrolled in first-year classes for data years 1980–1981 and 2006–2007. 4 Starting with 2005–2006 data, first-year enrollment for pharmacy schools include Pharm.D.1 enrollments only. Prior to 2005, first-year enrollment data include both Pharm.D.1, B.S. Pharmacy, and B.Pharm. enrollments. Includes second from last year for baccalaureate and third from last year for Pharm.D.1 and does not include first-year enrollees in accelerated programs. 5 Starting with 2008–2009 data, first-year enrollment data for public health schools include spring, summer, and fall enrollment. All other data years include fall enrollment only and are not directly comparable. 6 Includes data from a school of public health in Mexico as of 2007 school year. 7 Excludes graduates of ‘‘special’’ optometry degree programs which include, but are not limited to, accelerated programs for those entering optometry schools with a doctoral degree or graduates of foreign optometry programs and modified extended programs for those returning to schools after an absence, changing professional fields or taking a reduced course load for personal reasons. 8 Includes schools with preliminary and provisional accreditation, in addition to fully accredited schools. NOTE: Data on the number of schools and first-year enrollments are reported as of the beginning of the academic year, while data on the number of graduates are reported as of the end of the academic year. SOURCE: American Dental Association: 2012–2013 Survey of Dental Education Series, Report 1: Academic Programs, Enrollment and Graduates. Available from: http://www.ada.org/en/science-research/health-policy-institute/data-center/dental-education (Copyright 2014 American Dental Association. Reprinted with permission. All rights reserved.) Any form of reproduction is strictly prohibited without prior written permission of the American Dental Association; Association of American Medical Colleges (AAMC): AAMC Data Book 2014 - Medical Schools and Teaching Hospitals by the Numbers, Washington, DC. 2014. Table A1 (number of schools) and Table B1 (number of first-year enrollment students and number of graduates). Used with permission of the AAMC; American Association of Colleges of Osteopathic Medicine: Trends in Osteopathic Medical School Applicants, Enrollment and Graduates, 2014. Chevy Chase, MD. 2014. Available from: http://www.aacom.org/reports-programs-initiatives/aacom-reports. Reprinted with permission from AACOM, All rights reserved; Association of Schools and Colleges of Optometry: Annual Student Data Report Academic Years 2013–2014 and unpublished data. Available from: http://www.opted.org/data-surveys/; American Association of Colleges of Pharmacy: 2012–2013 Profile of Pharmacy Students. Available from: http://www.aacp.org/resources/research/institutionalresearch/Pages/StudentApplications,EnrollmentsandDegreesConferred.aspx; American Association of Colleges of Podiatric Medicine: Applicant, Matriculant, and Graduate Statistics, 2006 through 2013 and unpublished data. Available from: http://www.aacpm.org. Used with permission of the AACPM; Association of Schools & Programs of Public Health: unpublished data. Washington, DC. Used with permission of the ASPPH; Bureau of Health Professions: United States Health Personnel FACTBOOK. Health Resources and Services Administration. Rockville, MD. 2003. See Appendix I, American Dental Association (ADA); Association of American Medical Colleges (AAMC); American Association of Colleges of Osteopathic Medicine (AACOM); Association of Schools and Colleges of Optometry (ASCO); American Association of Colleges of Pharmacy (AACP); American Association of Colleges of Podiatric Medicine (AACPM); Association of Schools & Programs of Public Health (ASPPH). 296 Trend Tables Health, United States, 2014
Table 98. Hospitals, beds, and occupancy rates, by type of ownership and size of hospital: United States, selected years 1975–2012 [Data are based on reporting by a census of hospitals] Type of ownership and size of hospital 1975 1980 1990 2000 2005 2010 2011 2012 Hospitals Number All hospitals . ................. 7,156 6,965 6,649 5,810 5,756 5,754 5,724 5,723 Federal ................... 382 359 337 245 226 213 208 211 Nonfederal 1 ................ 6,774 6,606 6,312 5,565 5,530 5,541 5,516 5,512 Community 2 .............. 5,875 5,830 5,384 4,915 4,936 4,985 4,973 4,999 Nonprofit ............... 3,339 3,322 3,191 3,003 2,958 2,904 2,903 2,894 For profit ............... 775 730 749 749 868 1,013 1,025 1,068 State-local government ..... 1,761 1,778 1,444 1,163 1,110 1,068 1,045 1,037 6–24 beds .............. 299 259 226 288 370 424 445 462 25–49 beds ............. 1,155 1,029 935 910 1,032 1,167 1,177 1,192 50–99 beds ............. 1,481 1,462 1,263 1,055 1,001 970 955 954 100–199 beds ........... 1,363 1,370 1,306 1,236 1,129 1,029 1,005 1,012 200–299 beds ........... 678 715 739 656 619 585 582 570 300–399 beds ........... 378 412 408 341 368 352 353 348 400–499 beds ........... 230 266 222 182 173 185 184 189 500 beds or more ......... 291 317 285 247 244 273 272 272 Beds All hospitals . ................. 1,465,828 1,364,516 1,213,327 983,628 946,997 941,995 924,333 920,829 Federal ................... Nonfederal 1 ................ 131,946 1,333,882 117,328 1,247,188 98,255 1,115,072 53,067 930,561 45,837 901,160 44,940 897,055 38,065 886,268 38,557 882,272 Community 2 .............. 941,844 988,387 927,360 823,560 802,311 804,943 797,403 800,566 Nonprofit ............... 658,195 692,459 656,755 582,988 561,106 555,768 547,804 545,287 For profit ............... 73,495 87,033 101,377 109,883 113,510 124,652 128,371 135,008 State-local government ..... 210,154 208,895 169,228 130,689 127,695 124,523 121,228 120,271 6–24 beds .............. 5,615 4,932 4,427 5,156 6,316 7,261 7,616 7,791 25–49 beds ............. 41,783 37,478 35,420 33,333 33,726 37,446 37,680 38,338 50–99 beds ............. 106,776 105,278 90,394 75,865 71,737 69,470 67,844 67,879 100–199 beds ........... 192,438 192,892 183,867 175,778 161,593 148,090 143,843 145,556 200–299 beds ........... 164,405 172,390 179,670 159,807 151,290 142,616 141,308 139,212 300–399 beds ........... 127,728 139,434 138,938 117,220 126,899 121,749 122,269 120,554 400–499 beds ........... 101,278 117,724 98,833 80,763 76,894 82,071 81,699 84,007 500 beds or more ......... 201,821 218,259 195,811 175,638 173,856 196,240 195,144 197,229 Occupancy rate 3 Percent All hospitals . ................. 76.7 77.7 69.5 66.1 69.3 66.6 66.5 65.2 Federal ................... 80.7 80.1 72.9 68.2 66.0 65.3 69.1 63.5 Nonfederal 1 ................ 76.3 77.4 69.2 65.9 69.5 66.6 66.4 65.3 Community 2 .............. 75.0 75.2 66.8 63.9 67.3 64.5 64.3 63.4 Nonprofit ............... 77.5 78.2 69.3 65.5 69.1 66.2 66.0 64.9 For profit ............... 65.9 65.2 52.8 55.9 59.6 57.1 57.0 56.8 State-local government ..... 70.4 71.1 65.3 63.2 66.7 64.4 64.5 63.8 6–24 beds .............. 48.0 46.8 32.3 31.7 33.5 32.3 31.9 30.8 25–49 beds ............. 56.7 52.8 41.3 41.3 47.1 44.8 44.3 43.1 50–99 beds ............. 64.7 64.2 53.8 54.8 59.0 55.1 55.6 55.2 100–199 beds ........... 71.2 71.4 61.5 60.0 63.2 60.4 59.7 58.1 200–299 beds ........... 77.1 77.4 67.1 65.0 67.7 64.0 63.7 63.2 300–399 beds ........... 79.7 79.7 70.0 65.7 70.1 67.4 66.7 65.1 400–499 beds ........... 81.1 81.2 73.5 69.1 71.2 68.5 68.4 67.5 500 beds or more ......... 80.9 82.1 77.3 72.2 75.9 73.0 73.2 72.6 1 The category of nonfederal hospitals comprises psychiatric hospitals, tuberculosis and other respiratory diseases hospitals, and long-term and short-term general and other special hospitals. See Appendix II, Hospital. 2 Community hospitals are nonfederal short-term general and special hospitals whose facilities and services are available to the public. The types of facilities included in the community hospitals category have changed over time. See Appendix II, Hospital. 3 Estimated percentage of staffed beds that are occupied. Occupancy rate is calculated as the average daily census (from the American Hospital Association) divided by the number of hospital beds. See Appendix II, Occupancy rate. SOURCE: American Hospital Association (AHA) Annual Survey of Hospitals. Hospital Statistics, 1976, 1981, 1991–92, 2002, 2007, 2012, 2013, and 2014 editions. Chicago, IL. (Reprinted from AHA Hospital Statistics by permission, Copyright 1976, 1981, 1991–92, 2002, 2007, 2012, 2013, and 2014 by Health Forum, LLC, an American Hospital Association company.) See Appendix I, American Hospital Association (AHA) Annual Survey of Hospitals. Health, United States, 2014 Trend Tables 297
- Page 2:
Copyright information Permission ha
- Page 5 and 6:
Preface Health, United States, 2014
- Page 7 and 8:
Accessing Health, United States Hea
- Page 9 and 10:
Contents
- Page 11 and 12:
Trend Tables Health Status and Dete
- Page 13 and 14:
Figure 28. Prescription drug use in
- Page 15 and 16:
List of Trend Tables Health Status
- Page 17 and 18:
Table 64. Healthy weight, overweigh
- Page 19 and 20:
State Health Expenditures and Healt
- Page 21 and 22:
Health, United States, 2014: At a G
- Page 23 and 24:
Highlights This section presents se
- Page 25 and 26:
Use of Preventive Medical Care Serv
- Page 27 and 28:
Chartbook: Figures 1-19
- Page 29 and 30:
Mortality Selected Causes of Death
- Page 31 and 32:
Disability Measures Basic Actions D
- Page 33 and 34:
Health Risk Factors Overweight and
- Page 35 and 36:
Health Insurance Coverage Among Adu
- Page 37 and 38:
Personal Health Care Expenditures M
- Page 39 and 40:
Special Feature on Adults Aged 55-6
- Page 41 and 42:
Health, United States, 2014: Profil
- Page 43 and 44:
Selected Chronic Conditions For adu
- Page 45 and 46:
Current Cigarette Smoking In 2012-2
- Page 47 and 48:
Health Insurance Coverage For adult
- Page 49 and 50:
Use of Preventive Services and Scre
- Page 51 and 52:
Delay or Nonreceipt of Medical Care
- Page 53 and 54:
Data table for Figure 20. Death rat
- Page 55 and 56:
Data table for Figure 22. Serious o
- Page 57 and 58:
Data table for Figure 24. Participa
- Page 59 and 60:
Data table for Figure 26. Health ca
- Page 61 and 62:
Data table for Figure 28. Prescript
- Page 63 and 64:
Technical Notes Data Sources and Co
- Page 65 and 66:
26. Martinez ME, Cohen RA. Health i
- Page 67 and 68:
83. CDC. Vaccine recommendations of
- Page 69 and 70:
Table 1 (page 1 of 3). Resident pop
- Page 71 and 72:
Table 1 (page 3 of 3). Resident pop
- Page 73 and 74:
Table 2 (page 2 of 2). Persons belo
- Page 75 and 76:
Table 3 (page 2 of 3). Crude birth
- Page 77 and 78:
Table 4 (page 1 of 2). Teenage chil
- Page 79 and 80:
Table 5. Nonmarital childbearing, b
- Page 81 and 82:
Table 7 (page 1 of 3). Low birthwei
- Page 83 and 84:
Table 7 (page 3 of 3). Low birthwei
- Page 85 and 86:
Table 9 (page 1 of 6). Contraceptiv
- Page 87 and 88:
Table 9 (page 3 of 6). Contraceptiv
- Page 89 and 90:
Table 9 (page 5 of 6). Contraceptiv
- Page 91 and 92:
Table 10. Breastfeeding among mothe
- Page 93 and 94:
Table 11 (page 2 of 2). Infant, neo
- Page 95 and 96:
Table 13 (page 1 of 3). Infant mort
- Page 97 and 98:
Table 13 (page 3 of 3). Infant mort
- Page 99 and 100:
Table 15 (page 1 of 2). Life expect
- Page 101 and 102:
Table 16 (page 1 of 2). Life expect
- Page 103 and 104:
Table 17 (page 1 of 2). Age-adjuste
- Page 105 and 106:
Table 18 (page 1 of 4). Age-adjuste
- Page 107 and 108:
Table 18 (page 3 of 4). Age-adjuste
- Page 109 and 110:
Table 19 (page 1 of 4). Years of po
- Page 111 and 112:
Table 19 (page 3 of 4). Years of po
- Page 113 and 114:
Table 20 (page 1 of 4). Leading cau
- Page 115 and 116:
Table 20 (page 3 of 4). Leading cau
- Page 117 and 118:
Table 21 (page 1 of 2). Leading cau
- Page 119 and 120:
Table 22 (page 1 of 3). Age-adjuste
- Page 121 and 122:
Table 22 (page 3 of 3). Age-adjuste
- Page 123 and 124:
Table 23 (page 2 of 4). Death rates
- Page 125 and 126:
Table 23 (page 4 of 4). Death rates
- Page 127 and 128:
Table 24 (page 2 of 3). Death rates
- Page 129 and 130:
Table 25 (page 1 of 3). Death rates
- Page 131 and 132:
Table 25 (page 3 of 3). Death rates
- Page 133 and 134:
Table 26 (page 2 of 4). Death rates
- Page 135 and 136:
Table 26 (page 4 of 4). Death rates
- Page 137 and 138:
Table 27 (page 2 of 3). Death rates
- Page 139 and 140:
Table 28 (page 1 of 2). Death rates
- Page 141 and 142:
Table 29 (page 1 of 2). Death rates
- Page 143 and 144:
Table 30 (page 1 of 3). Death rates
- Page 145 and 146:
Table 30 (page 3 of 3). Death rates
- Page 147 and 148:
Table 31 (page 2 of 4). Death rates
- Page 149 and 150:
Table 31 (page 4 of 4). Death rates
- Page 151 and 152:
Table 32 (page 2 of 4). Death rates
- Page 153 and 154:
Table 32 (page 4 of 4). Death rates
- Page 155 and 156:
Table 33 (page 2 of 3). Death rates
- Page 157 and 158:
Table 34 (page 1 of 3). Death rates
- Page 159 and 160:
Table 34 (page 3 of 3). Death rates
- Page 161 and 162:
Table 36 (page 1 of 2). Occupationa
- Page 163 and 164:
Table 37 (page 1 of 2). Selected no
- Page 165 and 166:
Table 38 (page 1 of 2). Human immun
- Page 167 and 168:
Table 39 (page 1 of 5). Health cond
- Page 169 and 170:
Table 39 (page 3 of 5). Health cond
- Page 171 and 172:
Table 39 (page 5 of 5). Health cond
- Page 173 and 174:
Table 40 (page 2 of 4). Age-adjuste
- Page 175 and 176:
Table 40 (page 4 of 4). Age-adjuste
- Page 177 and 178:
Table 42 (page 1 of 2). Respondent-
- Page 179 and 180:
Table 43 (page 1 of 2). Number of r
- Page 181 and 182:
Table 44 (page 1 of 2). Diabetes pr
- Page 183 and 184:
Table 45 (page 1 of 2). End-stage r
- Page 185 and 186:
Table 46 (page 1 of 3). Severe head
- Page 187 and 188:
Table 46 (page 3 of 3). Severe head
- Page 189 and 190:
Table 47 (page 2 of 2). Disability
- Page 191 and 192:
Table 48 (page 2 of 2). Vision limi
- Page 193 and 194:
Table 49 (page 2 of 2). Hearing lim
- Page 195 and 196:
Table 50 (page 2 of 2). Respondent-
- Page 197 and 198:
Table 51 (page 2 of 2). Serious psy
- Page 199 and 200:
Table 52 (page 2 of 2). Current cig
- Page 201 and 202:
Table 54 (page 1 of 3). Current cig
- Page 203 and 204:
Table 54 (page 3 of 3). Current cig
- Page 205 and 206:
Table 55 (page 2 of 2). Use of sele
- Page 207 and 208:
Table 56 (page 2 of 3). Use of sele
- Page 209 and 210:
Table 57 (page 1 of 3). Health risk
- Page 211 and 212:
Table 57 (page 3 of 3). Health risk
- Page 213 and 214:
Table 58 (page 2 of 3). Heavier dri
- Page 215 and 216:
Table 59 (page 1 of 2). Selected he
- Page 217 and 218:
Table 60 (page 1 of 2). Hypertensio
- Page 219 and 220:
Table 61 (page 1 of 4). Cholesterol
- Page 221 and 222:
Table 61 (page 3 of 4). Cholesterol
- Page 223 and 224:
Table 62 (page 1 of 2). Mean macron
- Page 225 and 226:
Table 63 (page 1 of 5). Participati
- Page 227 and 228:
Table 63 (page 3 of 5). Participati
- Page 229 and 230:
Table 63 (page 5 of 5). Participati
- Page 231 and 232:
Table 64 (page 2 of 7). Healthy wei
- Page 233 and 234:
Table 64 (page 4 of 7). Healthy wei
- Page 235 and 236:
Table 64 (page 6 of 7). Healthy wei
- Page 237 and 238:
Table 65 (page 1 of 2). Obesity amo
- Page 239 and 240:
Table 66 (page 1 of 2). Untreated d
- Page 241 and 242:
Table 67 (page 1 of 2). No usual so
- Page 243 and 244:
Table 68 (page 1 of 2). No usual so
- Page 245 and 246:
Table 69 (page 1 of 3). Delay or no
- Page 247 and 248:
Table 69 (page 3 of 3). Delay or no
- Page 249 and 250:
Table 70 (page 2 of 2). No health c
- Page 251 and 252:
Table 71 (page 2 of 3). Health care
- Page 253 and 254:
Table 72 (page 1 of 3). Vaccination
- Page 255 and 256:
Table 72 (page 3 of 3). Vaccination
- Page 257 and 258:
Table 74 (page 1 of 2). Influenza v
- Page 259 and 260:
Table 75 (page 1 of 2). Pneumococca
- Page 261 and 262: Table 76 (page 1 of 3) . Use of mam
- Page 263 and 264: Table 76 (page 3 of 3). Use of mamm
- Page 265 and 266: Table 77 (page 2 of 5). Use of Pap
- Page 267 and 268: Table 77 (page 4 of 5). Use of Pap
- Page 269 and 270: Table 78 (page 1 of 2). Use of colo
- Page 271 and 272: Table 79 (page 1 of 4). Emergency d
- Page 273 and 274: Table 79 (page 3 of 4). Emergency d
- Page 275 and 276: Table 80 (page 1 of 3). Emergency d
- Page 277 and 278: Table 80 (page 3 of 3). Emergency d
- Page 279 and 280: Table 81 (page 2 of 2). Initial inj
- Page 281 and 282: Table 82 (page 2 of 3). Visits to p
- Page 283 and 284: Table 83 (page 1 of 2). Visits to p
- Page 285 and 286: Table 84 (page 1 of 2) . Dental vis
- Page 287 and 288: Table 85 (page 1 of 2). Prescriptio
- Page 289 and 290: Table 86 (page 1 of 3). Selected pr
- Page 291 and 292: Table 86 (page 3 of 3). Selected pr
- Page 293 and 294: Table 87 (page 2 of 4). Persons wit
- Page 295 and 296: Table 87 (page 4 of 4). Persons wit
- Page 297 and 298: Table 88 (page 2 of 3). Discharges,
- Page 299 and 300: Table 89 (page 1 of 3). Discharge r
- Page 301 and 302: Table 89 (page 3 of 3). Discharge r
- Page 303 and 304: Table 90 (page 2 of 4). Discharges
- Page 305 and 306: Table 90 (page 4 of 4). Discharges
- Page 307 and 308: Table 92. Active physicians and phy
- Page 309 and 310: Table 94. Doctors of medicine in pr
- Page 311: Table 96. Healthcare employment and
- Page 315 and 316: Table 100. Occupancy rates in commu
- Page 317 and 318: Table 101 (page 2 of 2). Nursing ho
- Page 319 and 320: Table 102 (page 2 of 2). Gross dome
- Page 321 and 322: Table 103 (page 2 of 2). National h
- Page 323 and 324: Table 104 (page 2 of 3). Personal h
- Page 325 and 326: Table 105 (page 1 of 3). Cost of ho
- Page 327 and 328: Table 105 (page 3 of 3). Cost of ho
- Page 329 and 330: Table 106 (page 2 of 3). Expenses f
- Page 331 and 332: Table 107 (page 1 of 3). Sources of
- Page 333 and 334: Table 107 (page 3 of 3). Sources of
- Page 335 and 336: Table 109 (page 1 of 2). National h
- Page 337 and 338: Table 110. Employers' costs per emp
- Page 339 and 340: Table 111 (page 2 of 3). Private he
- Page 341 and 342: Table 112 (page 1 of 3). Private he
- Page 343 and 344: Table 112 (page 3 of 3). Private he
- Page 345 and 346: Table 113 (page 2 of 3). Medicaid c
- Page 347 and 348: Table 114 (page 1 of 3). No health
- Page 349 and 350: Table 114 (page 3 of 3). No health
- Page 351 and 352: Table 115 (page 2 of 2). Health ins
- Page 353 and 354: Table 116 (page 2 of 2). Medicare e
- Page 355 and 356: Table 117 (page 2 of 2). Medicare b
- Page 357 and 358: Table 118 (page 2 of 2). Medicaid b
- Page 359 and 360: Table 120. Department of Veterans A
- Page 361 and 362: Table 121 (page 2 of 2). Medicare e
- Page 363 and 364:
Table 123 (page 1 of 3). Persons un
- Page 365 and 366:
Table 123 (page 3 of 3). Persons un
- Page 367 and 368:
Appendix Contents Appendix I. Data
- Page 369 and 370:
Mammography .......................
- Page 371 and 372:
Appendix I. Data Sources Health, Un
- Page 373 and 374:
institutional group quarters popula
- Page 375 and 376:
entire survey. In addition, some of
- Page 377 and 378:
Another source of Medicaid informat
- Page 379 and 380:
For More Information. See the CMS R
- Page 381 and 382:
Sample data are weighted to produce
- Page 383 and 384:
The estimation procedure used to pr
- Page 385 and 386:
with the Armed Forces (although the
- Page 387 and 388:
areas. EDs are treated as their own
- Page 389 and 390:
Methodology. NIS is a nationwide te
- Page 391 and 392:
National Notifiable Diseases Survei
- Page 393 and 394:
interviewing (ACASI), are used to p
- Page 395 and 396:
Coverage. Data presented in Health,
- Page 397 and 398:
Heron M, Hoyert DL, Murphy SL, et a
- Page 399 and 400:
specified rules for the collection,
- Page 401 and 402:
Quality Improvement Evaluation Syst
- Page 403 and 404:
information on treatment and payer
- Page 405 and 406:
Reference American Dental Associati
- Page 407 and 408:
For More Information. See The Guttm
- Page 409 and 410:
Table I. United States projected ye
- Page 411 and 412:
males and black females in 1950 are
- Page 413 and 414:
hypertension. Those with uncontroll
- Page 415 and 416:
Table IV. Cause-of-death codes, by
- Page 417 and 418:
High Blood Cholesterol in Adults (A
- Page 419 and 420:
Table V. Comparability of selected
- Page 421 and 422:
Dental caries was identified by an
- Page 423 and 424:
For more information on prescriptio
- Page 425 and 426:
public-use data release. NCHS. 2014
- Page 427 and 428:
Figure I. U.S. Census Bureau: Four
- Page 429 and 430:
with only Indian Health Service (IH
- Page 431 and 432:
Table VII. Percentage of persons un
- Page 433 and 434:
analytic purposes. See: NAACCR guid
- Page 435 and 436:
cause of death in ICD-9. The asteri
- Page 437 and 438:
Table IX. Codes for external causes
- Page 439 and 440:
U.S. life tables by Hispanic origin
- Page 441 and 442:
for Healthcare Research and Quality
- Page 443 and 444:
Affordable Care Act Provides Eligib
- Page 445 and 446:
Micropolitan statistical area—The
- Page 447 and 448:
In 2000 and 2003, women were asked
- Page 449 and 450:
see Appendix I, Population Census a
- Page 451 and 452:
Table XII. Codes for procedure cate
- Page 453 and 454:
Table XIV. Private health care cove
- Page 455 and 456:
the extent that race and Hispanic o
- Page 457 and 458:
Perinatal mortality rates and ratio
- Page 459 and 460:
coverage are considered uninsured.
- Page 461 and 462:
Index
- Page 463 and 464:
A—Con. Table/Figure (F) Asian or
- Page 465 and 466:
D Table/Figure (F) Deaths, death ra
- Page 467 and 468:
H—Con. Table/Figure (F) Hispanic
- Page 469 and 470:
M—Con. Table/Figure (F) Metropoli
- Page 471 and 472:
S Table/Figure (F) Salmonellosis, s