

hus14
hus14
hus14

You also want an ePaper? Increase the reach of your titles
YUMPU automatically turns print PDFs into web optimized ePapers that Google loves.
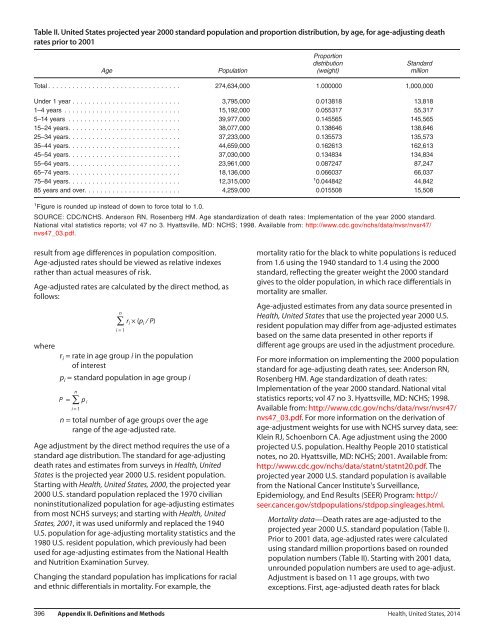
Table II. United States projected year 2000 standard population and proportion distribution, by age, for age-adjusting death<br />
rates prior to 2001<br />
Proportion<br />
distribution<br />
Standard<br />
Age Population (weight) million<br />
Total . ................................ 274,634,000 1.000000 1,000,000<br />
Under 1 year ........................... 3,795,000 0.013818 13,818<br />
1–4 years ............................. 15,192,000 0.055317 55,317<br />
5–14 years ............................ 39,977,000 0.145565 145,565<br />
15–24 years. . .......................... 38,077,000 0.138646 138,646<br />
25–34 years. . .......................... 37,233,000 0.135573 135,573<br />
35–44 years. . .......................... 44,659,000 0.162613 162,613<br />
45–54 years. . .......................... 37,030,000 0.134834 134,834<br />
55–64 years. . .......................... 23,961,000 0.087247 87,247<br />
65–74 years. . .......................... 18,136,000 0.066037 66,037<br />
75–84 years. . .......................... 12,315,000<br />
1 0.044842 44,842<br />
85 years and over. . . ..................... 4,259,000 0.015508 15,508<br />
1 Figure is rounded up instead of down to force total to 1.0.<br />
SOURCE: CDC/NCHS. Anderson RN, Rosenberg HM. Age standardization of death rates: Implementation of the year 2000 standard.<br />
National vital statistics reports; vol 47 no 3. Hyattsville, MD: NCHS; 1998. Available from: http://www.cdc.gov/nchs/data/nvsr/nvsr47/<br />
nvs47_03.pdf.<br />
result from age differences in population composition.<br />
Age-adjusted rates should be viewed as relative indexes<br />
rather than actual measures of risk.<br />
Age-adjusted rates are calculated by the direct method, as<br />
follows:<br />
where<br />
n<br />
∑ r i ×(p i /P)<br />
i= 1<br />
r i = rate in age group i in the population<br />
of interest<br />
p i = standard population in age group i<br />
n<br />
P= ∑ p i<br />
i= 1<br />
n = total number of age groups over the age<br />
range of the age-adjusted rate.<br />
Age adjustment by the direct method requires the use of a<br />
standard age distribution. The standard for age-adjusting<br />
death rates and estimates from surveys in Health, United<br />
States is the projected year 2000 U.S. resident population.<br />
Starting with Health, United States, 2000, the projected year<br />
2000 U.S. standard population replaced the 1970 civilian<br />
noninstitutionalized population for age-adjusting estimates<br />
from most NCHS surveys; and starting with Health, United<br />
States, 2001, it was used uniformly and replaced the 1940<br />
U.S. population for age-adjusting mortality statistics and the<br />
1980 U.S. resident population, which previously had been<br />
used for age-adjusting estimates from the National Health<br />
and Nutrition Examination Survey.<br />
Changing the standard population has implications for racial<br />
and ethnic differentials in mortality. For example, the<br />
mortality ratio for the black to white populations is reduced<br />
from 1.6 using the 1940 standard to 1.4 using the 2000<br />
standard, reflecting the greater weight the 2000 standard<br />
gives to the older population, in which race differentials in<br />
mortality are smaller.<br />
Age-adjusted estimates from any data source presented in<br />
Health, United States that use the projected year 2000 U.S.<br />
resident population may differ from age-adjusted estimates<br />
based on the same data presented in other reports if<br />
different age groups are used in the adjustment procedure.<br />
For more information on implementing the 2000 population<br />
standard for age-adjusting death rates, see: Anderson RN,<br />
Rosenberg HM. Age standardization of death rates:<br />
Implementation of the year 2000 standard. National vital<br />
statistics reports; vol 47 no 3. Hyattsville, MD: NCHS; 1998.<br />
Available from: http://www.cdc.gov/nchs/data/nvsr/nvsr47/<br />
nvs47_03.pdf. For more information on the derivation of<br />
age-adjustment weights for use with NCHS survey data, see:<br />
Klein RJ, Schoenborn CA. Age adjustment using the 2000<br />
projected U.S. population. Healthy People 2010 statistical<br />
notes, no 20. Hyattsville, MD: NCHS; 2001. Available from:<br />
http://www.cdc.gov/nchs/data/statnt/statnt20.pdf.The<br />
projected year 2000 U.S. standard population is available<br />
from the National Cancer Institute's Surveillance,<br />
Epidemiology, and End Results (SEER) Program: http://<br />
seer.cancer.gov/stdpopulations/stdpop.singleages.html.<br />
Mortality data—Death rates are age-adjusted to the<br />
projected year 2000 U.S. standard population (Table I).<br />
Prior to 2001 data, age-adjusted rates were calculated<br />
using standard million proportions based on rounded<br />
population numbers (Table II). Starting with 2001 data,<br />
unrounded population numbers are used to age-adjust.<br />
Adjustment is based on 11 age groups, with two<br />
exceptions. First, age-adjusted death rates for black<br />
396 Appendix II. Definitions and Methods Health, United States, 2014