

hus14
hus14
hus14

You also want an ePaper? Increase the reach of your titles
YUMPU automatically turns print PDFs into web optimized ePapers that Google loves.
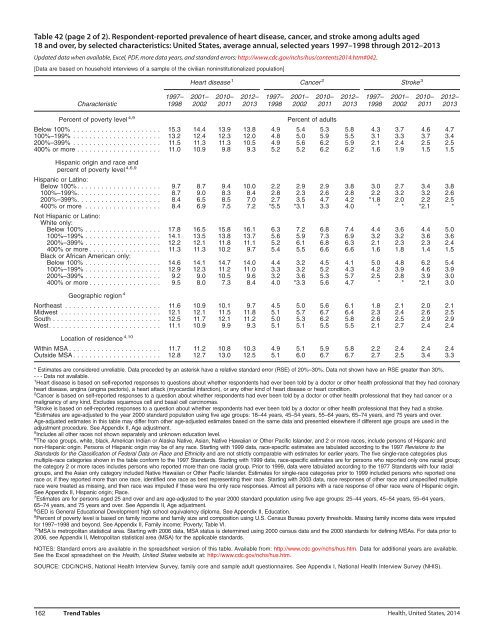
Table 42 (page 2 of 2). Respondent-reported prevalence of heart disease, cancer, and stroke among adults aged<br />
18 and over, by selected characteristics: United States, average annual, selected years 1997–1998 through 2012–2013<br />
Updated data when available, Excel, PDF, more data years, and standard errors: http://www.cdc.gov/nchs/hus/contents2014.htm#042.<br />
[Data are based on household interviews of a sample of the civilian noninstitutionalized population]<br />
Heart disease 1 Cancer 2 Stroke 3<br />
1997– 2001– 2010– 2012– 1997– 2001– 2010– 2012– 1997– 2001– 2010– 2012–<br />
Characteristic 1998 2002 2011 2013 1998 2002 2011 2013 1998 2002 2011 2013<br />
Percent of poverty level 4,9<br />
Percent of adults<br />
Below 100% ...................... 15.3 14.4 13.9 13.8 4.9 5.4 5.3 5.8 4.3 3.7 4.6 4.7<br />
100%–199% ...................... 13.2 12.4 12.3 12.0 4.8 5.0 5.9 5.5 3.1 3.3 3.7 3.4<br />
200%–399% ...................... 11.5 11.3 11.3 10.5 4.9 5.6 6.2 5.9 2.1 2.4 2.5 2.5<br />
400% or more ..................... 11.0 10.9 9.8 9.3 5.2 5.2 6.2 6.2 1.6 1.9 1.5 1.5<br />
Hispanic origin and race and<br />
percent of poverty level 4,6,9<br />
Hispanic or Latino:<br />
Below 100%. .................... 9.7 8.7 9.4 10.0 2.2 2.9 2.9 3.8 3.0 2.7 3.4 3.8<br />
100%–199%. .................... 8.7 9.0 8.3 8.4 2.8 2.3 2.6 2.8 2.2 3.2 3.2 2.6<br />
200%–399%. .................... 8.4 6.5 8.5 7.0 2.7 3.5 4.7 4.2 *1.8 2.0 2.2 2.5<br />
400% or more ................... 8.4 6.9 7.5 7.2 *5.5 *3.1 3.3 4.0 * * *2.1 *<br />
Not Hispanic or Latino:<br />
White only:<br />
Below 100% ................... 17.8 16.5 15.8 16.1 6.3 7.2 6.8 7.4 4.4 3.6 4.4 5.0<br />
100%–199% ................... 14.1 13.5 13.8 13.7 5.6 5.9 7.3 6.9 3.2 3.2 3.6 3.6<br />
200%–399% ................... 12.2 12.1 11.8 11.1 5.2 6.1 6.8 6.3 2.1 2.3 2.3 2.4<br />
400% or more .................. 11.3 11.3 10.2 9.7 5.4 5.5 6.6 6.6 1.6 1.8 1.4 1.5<br />
Black or African American only:<br />
Below 100% ................... 14.6 14.1 14.7 14.0 4.4 3.2 4.5 4.1 5.0 4.8 6.2 5.4<br />
100%–199% ................... 12.9 12.3 11.2 11.0 3.3 3.2 5.2 4.3 4.2 3.9 4.6 3.9<br />
200%–399% ................... 9.2 9.0 10.5 9.6 3.2 3.6 5.3 5.7 2.5 2.8 3.9 3.0<br />
400% or more .................. 9.5 8.0 7.3 8.4 4.0 *3.3 5.6 4.7 * * *2.1 3.0<br />
Geographic region 4<br />
Northeast ........................ 11.6 10.9 10.1 9.7 4.5 5.0 5.6 6.1 1.8 2.1 2.0 2.1<br />
Midwest ......................... 12.1 12.1 11.5 11.8 5.1 5.7 6.7 6.4 2.3 2.4 2.6 2.5<br />
South ........................... 12.5 11.7 12.1 11.2 5.0 5.3 6.2 5.8 2.6 2.5 2.9 2.9<br />
West............................ 11.1 10.9 9.9 9.3 5.1 5.1 5.5 5.5 2.1 2.7 2.4 2.4<br />
Location of residence 4,10<br />
Within MSA . ...................... 11.7 11.2 10.8 10.3 4.9 5.1 5.9 5.8 2.2 2.4 2.4 2.4<br />
Outside MSA . ..................... 12.8 12.7 13.0 12.5 5.1 6.0 6.7 6.7 2.7 2.5 3.4 3.3<br />
* Estimates are considered unreliable. Data preceded by an asterisk have a relative standard error (RSE) of 20%–30%. Data not shown have an RSE greater than 30%.<br />
---Data not available.<br />
1 Heart disease is based on self-reported responses to questions about whether respondents had ever been told by a doctor or other health professional that they had coronary<br />
heart disease, angina (angina pectoris), a heart attack (myocardial infarction), or any other kind of heart disease or heart condition.<br />
2 Cancer is based on self-reported responses to a question about whether respondents had ever been told by a doctor or other health professional that they had cancer or a<br />
malignancy of any kind. Excludes squamous cell and basal cell carcinomas.<br />
3 Stroke is based on self-reported responses to a question about whether respondents had ever been told by a doctor or other health professional that they had a stroke.<br />
4 Estimates are age-adjusted to the year 2000 standard population using five age groups: 18–44 years, 45–54 years, 55–64 years, 65–74 years, and 75 years and over.<br />
Age-adjusted estimates in this table may differ from other age-adjusted estimates based on the same data and presented elsewhere if different age groups are used in the<br />
adjustment procedure. See Appendix II, Age adjustment.<br />
5 Includes all other races not shown separately and unknown education level.<br />
6 The race groups, white, black, American Indian or Alaska Native, Asian, Native Hawaiian or Other Pacific Islander, and 2 or more races, include persons of Hispanic and<br />
non-Hispanic origin. Persons of Hispanic origin may be of any race. Starting with 1999 data, race-specific estimates are tabulated according to the 1997 Revisions to the<br />
Standards for the Classification of Federal Data on Race and Ethnicity and are not strictly comparable with estimates for earlier years. The five single-race categories plus<br />
multiple-race categories shown in the table conform to the 1997 Standards. Starting with 1999 data, race-specific estimates are for persons who reported only one racial group;<br />
the category 2 or more races includes persons who reported more than one racial group. Prior to 1999, data were tabulated according to the 1977 Standards with four racial<br />
groups, and the Asian only category included Native Hawaiian or Other Pacific Islander. Estimates for single-race categories prior to 1999 included persons who reported one<br />
race or, if they reported more than one race, identified one race as best representing their race. Starting with 2003 data, race responses of other race and unspecified multiple<br />
race were treated as missing, and then race was imputed if these were the only race responses. Almost all persons with a race response of other race were of Hispanic origin.<br />
See Appendix II, Hispanic origin; Race.<br />
7 Estimates are for persons aged 25 and over and are age-adjusted to the year 2000 standard population using five age groups: 25–44 years, 45–54 years, 55–64 years,<br />
65–74 years, and 75 years and over. See Appendix II, Age adjustment.<br />
8 GED is General Educational Development high school equivalency diploma. See Appendix II, Education.<br />
9 Percent of poverty level is based on family income and family size and composition using U.S. Census Bureau poverty thresholds. Missing family income data were imputed<br />
for 1997–1998 and beyond. See Appendix II, Family income; Poverty; Table VI.<br />
10 MSA is metropolitan statistical area. Starting with 2006 data, MSA status is determined using 2000 census data and the 2000 standards for defining MSAs. For data prior to<br />
2006, see Appendix II, Metropolitan statistical area (MSA) for the applicable standards.<br />
NOTES: Standard errors are available in the spreadsheet version of this table. Available from: http://www.cdc.gov/nchs/hus.htm. Data for additional years are available.<br />
See the Excel spreadsheet on the Health, United States website at: http://www.cdc.gov/nchs/hus.htm.<br />
SOURCE: CDC/NCHS, National Health Interview Survey, family core and sample adult questionnaires. See Appendix I, National Health Interview Survey (NHIS).<br />
162 Trend Tables Health, United States, 2014