

hus14
hus14
hus14

Create successful ePaper yourself
Turn your PDF publications into a flip-book with our unique Google optimized e-Paper software.
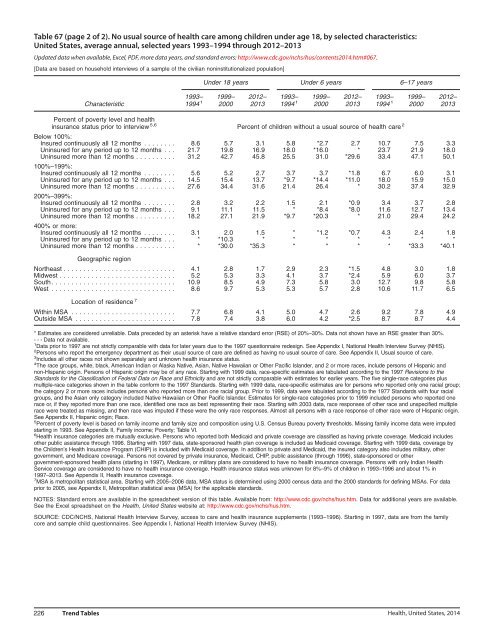
Table 67 (page 2 of 2). No usual source of health care among children under age 18, by selected characteristics:<br />
United States, average annual, selected years 1993–1994 through 2012–2013<br />
Updated data when available, Excel, PDF, more data years, and standard errors: http://www.cdc.gov/nchs/hus/contents2014.htm#067.<br />
[Data are based on household interviews of a sample of the civilian noninstitutionalized population]<br />
Under 18 years Under 6 years 6–17 years<br />
Characteristic<br />
1993– 1999–<br />
1994 1 2000<br />
2012–<br />
2013<br />
1993– 1999–<br />
1994 1 2000<br />
2012–<br />
2013<br />
1993– 1999–<br />
1994 1 2000<br />
2012–<br />
2013<br />
Percent of poverty level and health<br />
insurance status prior to interview 5,6 Percent of children without a usual source of health care 2<br />
Below 100%:<br />
Insured continuously all 12 months ........<br />
Uninsured for any period up to 12 months . . .<br />
Uninsured more than 12 months ..........<br />
100%–199%:<br />
Insured continuously all 12 months ........<br />
Uninsured for any period up to 12 months . . .<br />
Uninsured more than 12 months ..........<br />
200%–399%:<br />
Insured continuously all 12 months ........<br />
Uninsured for any period up to 12 months . . .<br />
Uninsured more than 12 months ..........<br />
400% or more:<br />
Insured continuously all 12 months ........<br />
Uninsured for any period up to 12 months . . .<br />
Uninsured more than 12 months ..........<br />
8.6<br />
21.7<br />
31.2<br />
5.6<br />
14.5<br />
27.6<br />
2.8<br />
9.1<br />
18.2<br />
3.1<br />
*<br />
*<br />
5.7<br />
19.8<br />
42.7<br />
5.2<br />
15.4<br />
34.4<br />
3.2<br />
11.1<br />
27.1<br />
2.0<br />
*10.3<br />
*30.0<br />
3.1<br />
16.9<br />
45.8<br />
2.7<br />
13.7<br />
31.6<br />
2.2<br />
11.5<br />
21.9<br />
1.5<br />
*<br />
*35.3<br />
5.8<br />
18.0<br />
25.5<br />
3.7<br />
*9.7<br />
21.4<br />
1.5<br />
*<br />
*9.7<br />
*<br />
*<br />
*<br />
*2.7<br />
*16.0<br />
31.0<br />
3.7<br />
*14.4<br />
26.4<br />
2.1<br />
*8.4<br />
*20.3<br />
*1.2<br />
*<br />
*<br />
2.7<br />
*<br />
*29.6<br />
*1.8<br />
*11.0<br />
*<br />
*0.9<br />
*8.0<br />
*<br />
*0.7<br />
*<br />
*<br />
10.7<br />
23.7<br />
33.4<br />
6.7<br />
18.0<br />
30.2<br />
3.4<br />
11.6<br />
21.0<br />
4.3<br />
*<br />
*<br />
7.5<br />
21.9<br />
47.1<br />
6.0<br />
15.9<br />
37.4<br />
3.7<br />
12.7<br />
29.4<br />
2.4<br />
*<br />
*33.3<br />
3.3<br />
18.0<br />
50.1<br />
3.1<br />
15.0<br />
32.9<br />
2.8<br />
13.4<br />
24.2<br />
1.8<br />
*<br />
*40.1<br />
Geographic region<br />
Northeast ............................<br />
Midwest .............................<br />
South. ..............................<br />
West ...............................<br />
4.1<br />
5.2<br />
10.9<br />
8.6<br />
2.8<br />
5.3<br />
8.5<br />
9.7<br />
1.7<br />
3.3<br />
4.9<br />
5.3<br />
2.9<br />
4.1<br />
7.3<br />
5.3<br />
2.3<br />
3.7<br />
5.8<br />
5.7<br />
*1.5<br />
*2.4<br />
3.0<br />
2.8<br />
4.8<br />
5.9<br />
12.7<br />
10.6<br />
3.0<br />
6.0<br />
9.8<br />
11.7<br />
1.8<br />
3.7<br />
5.8<br />
6.5<br />
Location of residence 7<br />
Within MSA ..........................<br />
Outside MSA .........................<br />
7.7<br />
7.8<br />
6.8<br />
7.4<br />
4.1<br />
3.8<br />
5.0<br />
6.0<br />
4.7<br />
4.2<br />
2.6<br />
*2.5<br />
9.2<br />
8.7<br />
7.8<br />
8.7<br />
4.9<br />
4.4<br />
* Estimates are considered unreliable. Data preceded by an asterisk have a relative standard error (RSE) of 20%–30%. Data not shown have an RSE greater than 30%.<br />
---Data not available.<br />
1 Data prior to 1997 are not strictly comparable with data for later years due to the 1997 questionnaire redesign. See Appendix I, National Health Interview Survey (NHIS).<br />
2 Persons who report the emergency department as their usual source of care are defined as having no usual source of care. See Appendix II, Usual source of care.<br />
3 Includes all other races not shown separately and unknown health insurance status.<br />
4 The race groups, white, black, American Indian or Alaska Native, Asian, Native Hawaiian or Other Pacific Islander, and 2 or more races, include persons of Hispanic and<br />
non-Hispanic origin. Persons of Hispanic origin may be of any race. Starting with 1999 data, race-specific estimates are tabulated according to the 1997 Revisions to the<br />
Standards for the Classification of Federal Data on Race and Ethnicity and are not strictly comparable with estimates for earlier years. The five single-race categories plus<br />
multiple-race categories shown in the table conform to the 1997 Standards. Starting with 1999 data, race-specific estimates are for persons who reported only one racial group;<br />
the category 2 or more races includes persons who reported more than one racial group. Prior to 1999, data were tabulated according to the 1977 Standards with four racial<br />
groups, and the Asian only category included Native Hawaiian or Other Pacific Islander. Estimates for single-race categories prior to 1999 included persons who reported one<br />
race or, if they reported more than one race, identified one race as best representing their race. Starting with 2003 data, race responses of other race and unspecified multiple<br />
race were treated as missing, and then race was imputed if these were the only race responses. Almost all persons with a race response of other race were of Hispanic origin.<br />
See Appendix II, Hispanic origin; Race.<br />
5 Percent of poverty level is based on family income and family size and composition using U.S. Census Bureau poverty thresholds. Missing family income data were imputed<br />
starting in 1993. See Appendix II, Family income; Poverty; Table VI.<br />
6 Health insurance categories are mutually exclusive. Persons who reported both Medicaid and private coverage are classified as having private coverage. Medicaid includes<br />
other public assistance through 1996. Starting with 1997 data, state-sponsored health plan coverage is included as Medicaid coverage. Starting with 1999 data, coverage by<br />
the Children’s Health Insurance Program (CHIP) is included with Medicaid coverage. In addition to private and Medicaid, the insured category also includes military, other<br />
government, and Medicare coverage. Persons not covered by private insurance, Medicaid, CHIP, public assistance (through 1996), state-sponsored or other<br />
government-sponsored health plans (starting in 1997), Medicare, or military plans are considered to have no health insurance coverage. Persons with only Indian Health<br />
Service coverage are considered to have no health insurance coverage. Health insurance status was unknown for 8%–9% of children in 1993–1996 and about 1%in<br />
1997–2013. See Appendix II, Health insurance coverage.<br />
7 MSA is metropolitan statistical area. Starting with 2005–2006 data, MSA status is determined using 2000 census data and the 2000 standards for defining MSAs. For data<br />
prior to 2005, see Appendix II, Metropolitan statistical area (MSA) for the applicable standards.<br />
NOTES: Standard errors are available in the spreadsheet version of this table. Available from: http://www.cdc.gov/nchs/hus.htm. Data for additional years are available.<br />
See the Excel spreadsheet on the Health, United States website at: http://www.cdc.gov/nchs/hus.htm.<br />
SOURCE: CDC/NCHS, National Health Interview Survey, access to care and health insurance supplements (1993–1996). Starting in 1997, data are from the family<br />
core and sample child questionnaires. See Appendix I, National Health Interview Survey (NHIS).<br />
226 Trend Tables Health, United States, 2014