

hus14
hus14
hus14

You also want an ePaper? Increase the reach of your titles
YUMPU automatically turns print PDFs into web optimized ePapers that Google loves.
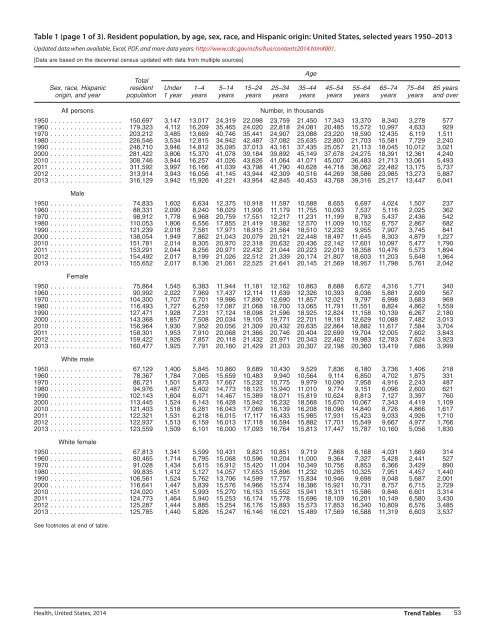
Table 1 (page 1 of 3). Resident population, by age, sex, race, and Hispanic origin: United States, selected years 1950–2013<br />
Updated data when available, Excel, PDF, and more data years: http://www.cdc.gov/nchs/hus/contents2014.htm#001.<br />
[Data are based on the decennial census updated with data from multiple sources]<br />
Age<br />
Total<br />
Sex, race, Hispanic resident Under 1–4 5–14 15–24 25–34 35–44 45–54 55–64 65–74 75–84 85 years<br />
origin, and year population 1 year years years years years years years years years years and over<br />
All persons<br />
Number, in thousands<br />
1950 .................. 150,697 3,147 13,017 24,319 22,098 23,759 21,450 17,343 13,370 8,340 3,278 577<br />
1960 .................. 179,323 4,112 16,209 35,465 24,020 22,818 24,081 20,485 15,572 10,997 4,633 929<br />
1970 .................. 203,212 3,485 13,669 40,746 35,441 24,907 23,088 23,220 18,590 12,435 6,119 1,511<br />
1980 .................. 226,546 3,534 12,815 34,942 42,487 37,082 25,635 22,800 21,703 15,581 7,729 2,240<br />
1990 .................. 248,710 3,946 14,812 35,095 37,013 43,161 37,435 25,057 21,113 18,045 10,012 3,021<br />
2000 .................. 281,422 3,806 15,370 41,078 39,184 39,892 45,149 37,678 24,275 18,391 12,361 4,240<br />
2010 .................. 308,746 3,944 16,257 41,026 43,626 41,064 41,071 45,007 36,483 21,713 13,061 5,493<br />
2011 .................. 311,592 3,997 16,166 41,039 43,798 41,790 40,628 44,718 38,062 22,482 13,175 5,737<br />
2012 .................. 313,914 3,943 16,056 41,145 43,944 42,309 40,516 44,269 38,586 23,985 13,273 5,887<br />
2013 .................. 316,129 3,942 15,926 41,221 43,954 42,845 40,453 43,768 39,316 25,217 13,447 6,041<br />
Male<br />
1950 .................. 74,833 1,602 6,634 12,375 10,918 11,597 10,588 8,655 6,697 4,024 1,507 237<br />
1960 .................. 88,331 2,090 8,240 18,029 11,906 11,179 11,755 10,093 7,537 5,116 2,025 362<br />
1970 .................. 98,912 1,778 6,968 20,759 17,551 12,217 11,231 11,199 8,793 5,437 2,436 542<br />
1980 .................. 110,053 1,806 6,556 17,855 21,419 18,382 12,570 11,009 10,152 6,757 2,867 682<br />
1990 .................. 121,239 2,018 7,581 17,971 18,915 21,564 18,510 12,232 9,955 7,907 3,745 841<br />
2000 .................. 138,054 1,949 7,862 21,043 20,079 20,121 22,448 18,497 11,645 8,303 4,879 1,227<br />
2010 .................. 151,781 2,014 8,305 20,970 22,318 20,632 20,436 22,142 17,601 10,097 5,477 1,790<br />
2011 .................. 153,291 2,044 8,256 20,971 22,432 21,044 20,223 22,019 18,358 10,476 5,573 1,894<br />
2012 .................. 154,492 2,017 8,199 21,026 22,512 21,339 20,174 21,807 18,603 11,203 5,648 1,964<br />
2013 .................. 155,652 2,017 8,136 21,061 22,525 21,641 20,145 21,569 18,957 11,798 5,761 2,042<br />
Female<br />
1950 .................. 75,864 1,545 6,383 11,944 11,181 12,162 10,863 8,688 6,672 4,316 1,771 340<br />
1960 .................. 90,992 2,022 7,969 17,437 12,114 11,639 12,326 10,393 8,036 5,881 2,609 567<br />
1970 .................. 104,300 1,707 6,701 19,986 17,890 12,690 11,857 12,021 9,797 6,998 3,683 969<br />
1980 .................. 116,493 1,727 6,259 17,087 21,068 18,700 13,065 11,791 11,551 8,824 4,862 1,559<br />
1990 .................. 127,471 1,928 7,231 17,124 18,098 21,596 18,925 12,824 11,158 10,139 6,267 2,180<br />
2000 .................. 143,368 1,857 7,508 20,034 19,105 19,771 22,701 19,181 12,629 10,088 7,482 3,013<br />
2010 .................. 156,964 1,930 7,952 20,056 21,309 20,432 20,635 22,864 18,882 11,617 7,584 3,704<br />
2011 .................. 158,301 1,953 7,910 20,068 21,366 20,746 20,404 22,699 19,704 12,005 7,602 3,843<br />
2012 .................. 159,422 1,926 7,857 20,118 21,432 20,971 20,343 22,462 19,983 12,783 7,624 3,923<br />
2013 .................. 160,477 1,925 7,791 20,160 21,429 21,203 20,307 22,198 20,360 13,419 7,686 3,999<br />
White male<br />
1950 .................. 67,129 1,400 5,845 10,860 9,689 10,430 9,529 7,836 6,180 3,736 1,406 218<br />
1960 .................. 78,367 1,784 7,065 15,659 10,483 9,940 10,564 9,114 6,850 4,702 1,875 331<br />
1970 .................. 86,721 1,501 5,873 17,667 15,232 10,775 9,979 10,090 7,958 4,916 2,243 487<br />
1980 .................. 94,976 1,487 5,402 14,773 18,123 15,940 11,010 9,774 9,151 6,096 2,600 621<br />
1990 .................. 102,143 1,604 6,071 14,467 15,389 18,071 15,819 10,624 8,813 7,127 3,397 760<br />
2000 .................. 113,445 1,524 6,143 16,428 15,942 16,232 18,568 15,670 10,067 7,343 4,419 1,109<br />
2010 .................. 121,403 1,518 6,281 16,043 17,069 16,139 16,208 18,096 14,840 8,726 4,866 1,617<br />
2011 .................. 122,321 1,531 6,218 16,015 17,117 16,433 15,985 17,931 15,423 9,033 4,926 1,710<br />
2012 .................. 122,937 1,513 6,159 16,013 17,118 16,594 15,882 17,701 15,549 9,667 4,977 1,766<br />
2013 .................. 123,559 1,509 6,101 16,000 17,093 16,764 15,813 17,447 15,787 10,160 5,056 1,830<br />
White female<br />
1950 .................. 67,813 1,341 5,599 10,431 9,821 10,851 9,719 7,868 6,168 4,031 1,669 314<br />
1960 .................. 80,465 1,714 6,795 15,068 10,596 10,204 11,000 9,364 7,327 5,428 2,441 527<br />
1970 .................. 91,028 1,434 5,615 16,912 15,420 11,004 10,349 10,756 8,853 6,366 3,429 890<br />
1980 .................. 99,835 1,412 5,127 14,057 17,653 15,896 11,232 10,285 10,325 7,951 4,457 1,440<br />
1990 .................. 106,561 1,524 5,762 13,706 14,599 17,757 15,834 10,946 9,698 9,048 5,687 2,001<br />
2000 .................. 116,641 1,447 5,839 15,576 14,966 15,574 18,386 15,921 10,731 8,757 6,715 2,729<br />
2010 .................. 124,020 1,451 5,993 15,270 16,153 15,552 15,941 18,311 15,586 9,846 6,601 3,314<br />
2011 .................. 124,773 1,464 5,940 15,253 16,174 15,778 15,696 18,109 16,201 10,149 6,580 3,430<br />
2012 .................. 125,287 1,444 5,885 15,254 16,176 15,893 15,573 17,853 16,340 10,809 6,576 3,485<br />
2013 .................. 125,785 1,440 5,826 15,247 16,146 16,021 15,489 17,569 16,588 11,319 6,603 3,537<br />
See footnotes at end of table.<br />
Health, United States, 2014 Trend Tables 53